Most of the U.S. Coast Is Sinking, and a New Map Shows Where It Is Worst
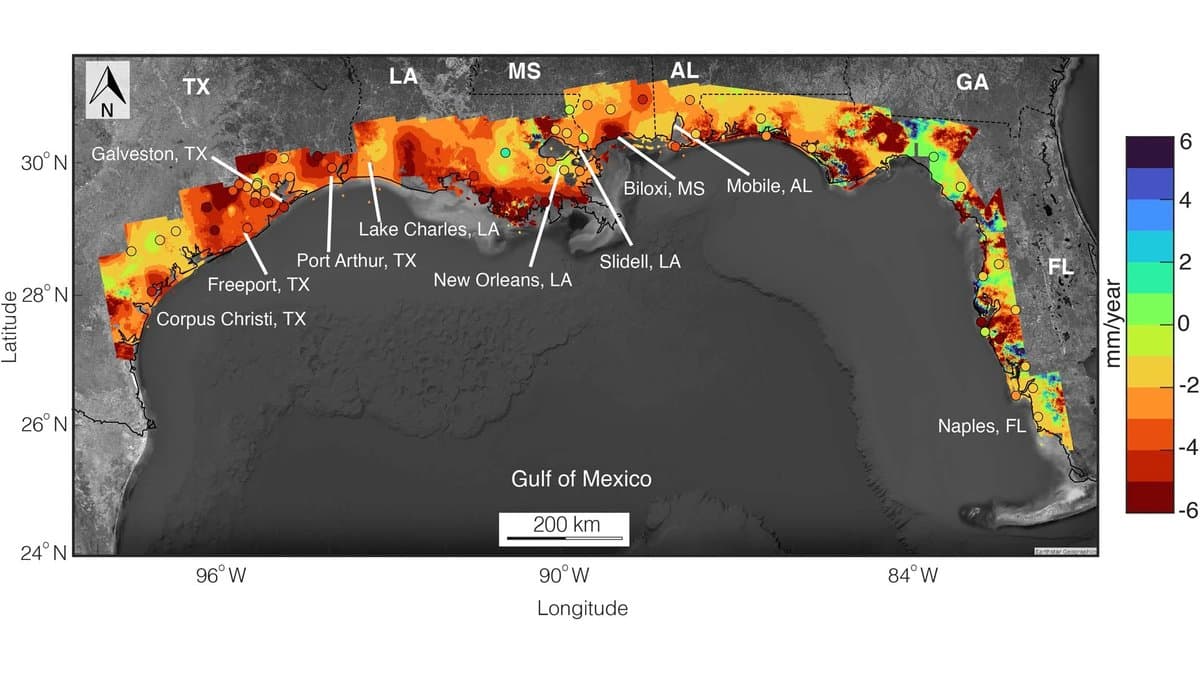
Mohammed Azhar of Tufts University, Manoochehr Shirzaei of Virginia Tech and colleagues have measured how fast the ground is sinking along the coasts of the United States, and report that 71.5% of the coastal land area they mapped across 20 coastal states is dropping faster than 0.1 centimeters a year. Their study was published Sept. 22 in the open-access journal Communications Earth & Environment.
The study sorts the coast into low, moderate and high levels of subsidence hazard, the term for sinking ground. The authors present it as a foundation for coastal planning and for adapting what is built along the shore, and describe it as the first national-scale account of that hazard and of who is exposed to it.
Subsidence is land moving down, not water moving up. The two add together where they meet, but they are separate measurements. The paper's figures come from more than 190 million readings of vertical land motion, taken from radar satellite imagery and ground observations.
The team reports that the Gulf Coast carries the highest rates. Nationally, they found that sinking rates are best described by a heavy-tailed distribution, which means fast-sinking pockets are more common than a national average would suggest. Land that is rising follows a different pattern.
The researchers also overlaid the hazard map with coastal demographics and infrastructure, finding that exposure is disproportionate for disadvantaged communities and for critical infrastructure systems.
The National Science Foundation supported part of the work.
Sources
- Communications Earth & EnvironmentPeer-reviewed