A Wildfire Map for the Czech-German Border, Tested on the People Who Would Use It

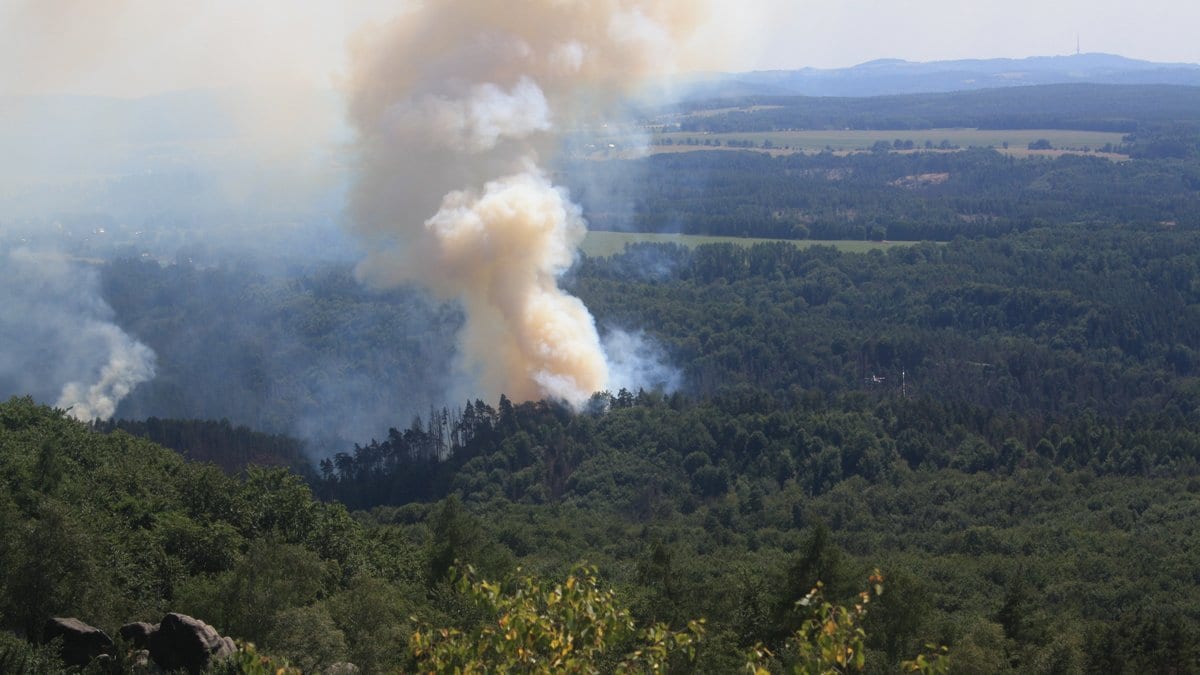
In late July 2022, a fire set deliberately in the sandstone gorges of the Czech Elbe country began to move north. It burned into August, crossed an international border, and left two national park administrations, two fire services and two languages managing one event. Central Europe's professional and volunteer fire brigades have a long tradition behind them. Almost none of it was built around a forest fire arriving at the edge of a village.
The region had, as the researchers put it, been historically spared destructive wildfires where houses meet forest. That was never the same as having no fire problem. Fire-conducive weather in the Czech Republic has been increasing since the 1960s, and a drought-driven bark-beetle outbreak killed spruce across Central Europe in the years before the fire, leaving standing deadwood and dense young regrowth behind it.
A study published Aug. 26 in Natural Hazards and Earth System Sciences takes that as its premise and asks something narrower: which settlements here are exposed now? Evripidis Avouris and Matthias Forkel, of the environmental remote sensing group at TU Dresden, and colleagues including researchers at the Global Change Research Institute of the Czech Academy of Sciences, built an interactive wildfire exposure map for the whole transboundary block: the national parks of Saxon and Bohemian Switzerland and the conservation areas around them, more than two-thirds of it forest.
How long the fire is allowed to burn
The map is the output of FlamMap, a landscape fire model from the Missoula Fire Sciences Laboratory in the United States that had already been used on this exact area to reconstruct the 2022 fire. The team gave it topography, canopy cover and a fuel map built from satellite classification and then checked on foot, and started fires from hundreds of recorded and plausible ignition points, at a resolution fine enough to pick out individual buildings.
Every run combined a fire-danger level, one of the prevailing winds that goes with it, and a duration: one day, two days or three. That last axis is the one that moved the results. Burn probability, the share of simulated fires that reach a given patch of ground, climbed with every extra day the model let a fire run, while flame length barely responded to duration at all and tracked the fire weather instead. The real fire burned for weeks, but most of its spread came in its first three days, which is where the window comes from.
Exposure was then read at the doorstep. For each residential building the model summarized the hazard inside the 60-meter ring around it (the home ignition zone, the band where a landing ember decides whether a house catches) and rolled those values up to the municipalities on both sides of the border.
Which country a village sits in explains little
Under the harshest combination in the set, very high fire danger and a fire running three days, the highest median burn probability of any municipality was Sebnitz, on the German side, at 15 percent, with Mikulášovice, Hohnstein, Vilémov and Rathmannsdorf next. The five highest median flame lengths were all Czech, reaching about 3.5 meters in Veselé. The authors read the burn-probability pattern as geometry rather than nationality: those places sit near a dense cluster of recorded ignitions around Bad Schandau, or along the corridors that lead away from it under the dominant winds. A German ignition cluster, on their reading, feeds exposure in Czech villages.
The Elbe held. Simulated fires rarely crossed the river in any scenario: partly a real barrier, partly an artifact, because the model has no way to throw burning material over one. Up-to-date canopy data for the beetle-killed stands was not available, so crown fire and the firebrands it launches were left out, which the authors say may mean spread and intensity are underestimated under extreme weather.
Checked against one fire, then against readers
The framework was tested against what the 2022 fire actually did, using satellite heat detections as a stand-in for its daily perimeter. The first day barely matched: firefighters reported the wind swinging around all day, and each simulation carries a single fixed wind. The second and third days lined up much better, and by the third the simulation covered most of the observed burn while also spilling well past it on the German side, where crews mounted a defense the model knows nothing about. One fire is one case, and no historical fire perimeters exist for this area to add more, so the team writes that the evaluation "should be interpreted as an informed consistency check rather than as a strict validation of accuracy."
Then the map went to its readers. Fifty people completed a usability questionnaire, GIS and cartography professionals alongside members of the public, after doing a real task on it: find the route from a given settlement to its nearest fire station under a named scenario, and judge that settlement's exposure. The professionals mostly found this easy. Everyone else landed on neutral. Asked what the blue areas meant, 78 percent answered correctly. Participants generally rated the map easy to use and interpreted its two-color legend correctly in most cases; those hedges are the authors' own.
The second questionnaire, aimed at the professionals who might use the map at work, came back from two people. One, at the Bohemian Switzerland National Park administration, doubted the modeling's accuracy and pointed to forest roads in the data that are outdated or disconnected. The other, from Germany's Virtual Operations Support Team, saw little use for it in current operations but asked for printable and open-format versions, a request that moved the map off a proprietary platform and onto open-source software. Both rated the settlement and fire-station layers as highly relevant.
The map itself is downloadable under its own DOI and the paper is open access, so a park administration or a district fire association can take the rasters rather than ask for them. Zoom in on the village of Mezná and the buildings layer shows which structures stood inside the 2022 fire perimeter. Mapping like this in Central Europe, the authors write, is still at a relatively early stage, and their conclusion is about the border as much as the fire: wildfires cross it, and the services on either side need to share data and plan together.