Your Pension Owns Buildings, and Some of Them Sit in a Floodplain

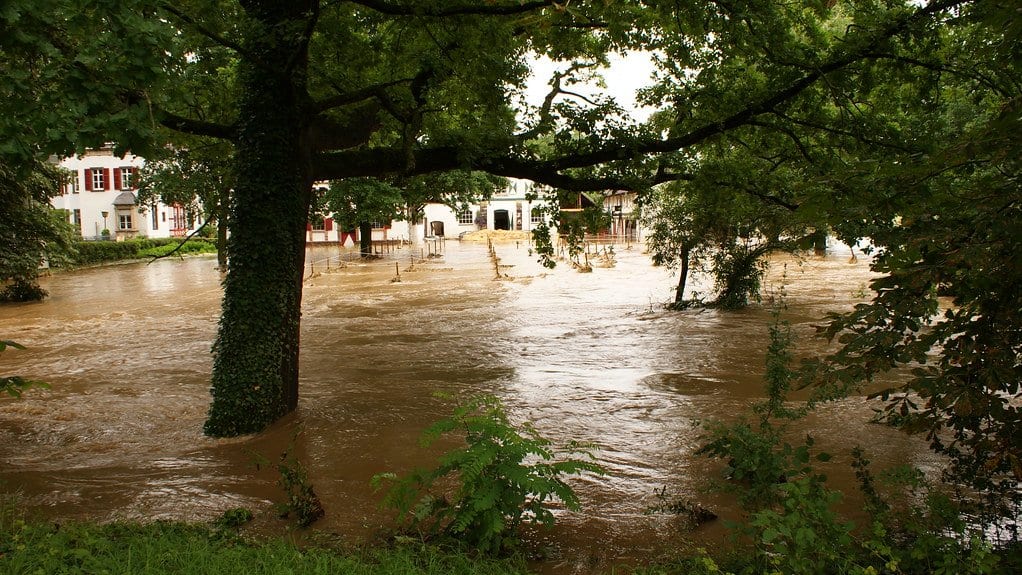
Somewhere in a pension fund's accounts there is a line for property: warehouses, offices, retail parks. It is a large line, and it is the part of the portfolio that cannot be moved when a river comes up. What the fund almost never has is a number for that: how much of its building stock sits on a floodplain, and what a wet decade would cost.
Laura Dawkins and colleagues at the UK Met Office have now published a way to work one out. Their framework, which appeared in Natural Hazards and Earth System Sciences on Aug. 26, estimates flood damage to a property portfolio from datasets that are free to download: climate-model rainfall, European river flood maps and standard curves relating flood depth to money lost.
The chain runs like this. Rainfall extremes across the region come from the UK's national climate projections. A statistical curve converts a rainfall return level into a flood depth, anchored to the Copernicus flood hazard maps that Europe's emergency service publishes for the continent's rivers. Satellite-mapped commercial floor space, priced at national construction costs, gives the value standing in each cell of the map. A depth-damage curve turns a meter of water into a share of that value destroyed. Integrate across every flood probability and the result is Expected Annual Damage: what an owner should expect to lose in an average year, quiet ones and catastrophic ones alike.
That second step is where the framework buys its reach and pays for it. Turning rain into flood depth is normally the work of a hydrological model that follows water off hillsides, through soil and down channels; here it is a smooth curve fitted between two sets of return levels, and the paper says repeatedly that it is not validated against observed floods or against hydrological simulations. The flood maps underneath show river flooding only, contain no flood defenses and describe the present day, so water pouring off streets and roofs is missing from every figure that follows. The authors' verdict is in their own abstract: the results are "indicative rather than decision-ready." Anyone tempted to price a real building on them should read that line first.
Applied across north-west Europe, the framework finds risk that is already material and rising almost everywhere. The domain covers the UK, Belgium, the Netherlands, Denmark and parts of France, Germany, Czechia, Poland, Norway and Sweden. Between a 1990–2016 baseline and the 2025–2054 window, all but a fraction of the at-risk locations get worse, many by more than a fifth and a few by several times over. Those changes are what the method was built to see. The absolute damages are shakier: they come from 100-meter squares in city centers rather than whole cities, and the paper warns they cannot be set beside the reported losses of real floods.
The finance-facing part of the paper turns on two invented portfolios. Each holds 450 sites and about EUR 0.89 billion of commercial property, and on a map they look much alike. One was drawn so that a fifth of its buildings sit somewhere a river can reach; in the other, four-fifths do. Their expected annual losses are not close, in either period. Only 7.5% of candidate commercial locations across the region are exposed to river flooding at all, which is what lets two portfolios of the same size and value diverge so far.
Repeat the exercise across 100 synthetic portfolios and the pattern holds: within this framework, the spread in risk caused by where the buildings are is consistently wider than the spread caused by the climate model. The finding is real for portfolio construction and narrow for climate uncertainty. The climate side here is one model: 12 variants of the Met Office's HadGEM3, run under a single high-emissions pathway, RCP8.5, without bias correction. Disagreement between different models, and between emissions scenarios, is absent by construction.
The last section is an illustration the paper labels a toy example, and it is worth reading as one. Protect every building in the higher-risk portfolio against the flood depth that used to arrive once a decade, at an assumed EUR 500 per square meter for a meter of water, and the bill comes to about EUR 400 million. Expected annual damage across the portfolio falls from roughly EUR 130 million to around EUR 36 million, and the running cost of having adapted drops below the cost of not having adapted in year five. None of that arithmetic is discounted, no defense is allowed to fail, and every building is protected at once; a real appraisal would do none of those things.
The case for a method like this is not that it beats what the industry sells; it is that it can be inspected. A benchmarking exercise for the UK's Climate Financial Risk Forum put the same asset in front of 13 climate-risk vendors and got back materially different hazard estimates and damages, with no way to see which assumption caused the gap. Every dataset in the Met Office chain is public and carries a DOI; the code that assembles them is not archived, and comes from the authors on request. What that offers a fund is a screen: a first pass over which of its buildings sit near a river, before paying someone to model the ones that do.