The Global Flood Model Reads Ghana's White Volta as Nearly Dry

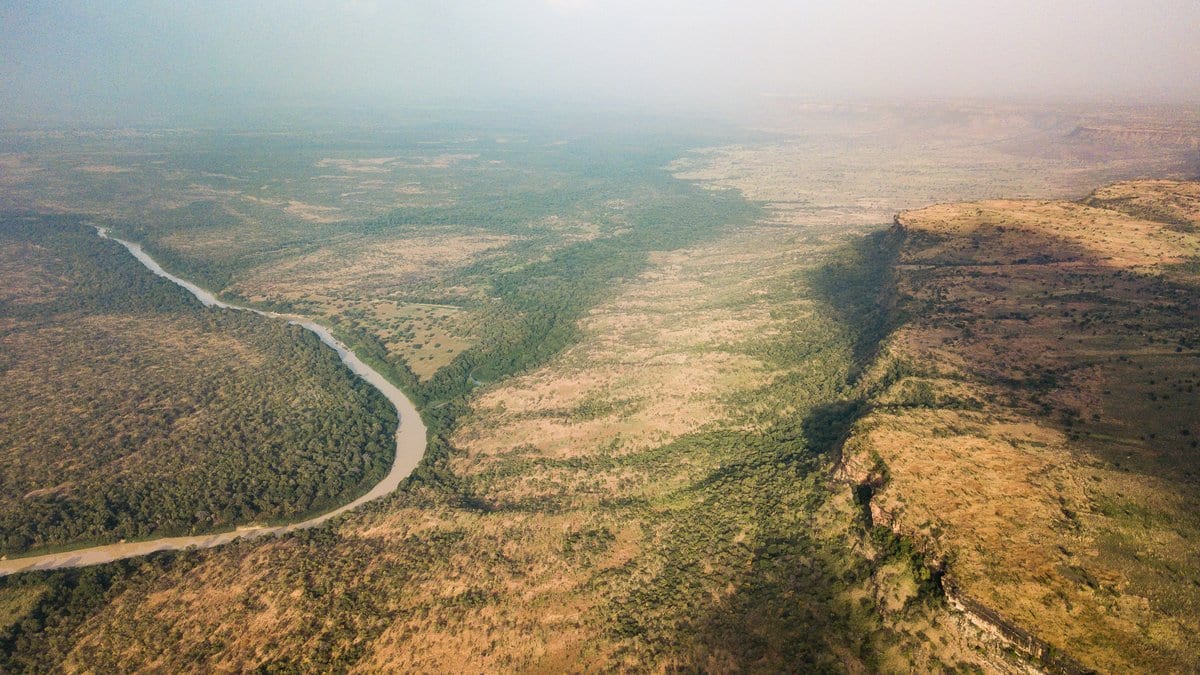
Every year from June to October, the White Volta fills. At Nawuni, the gauge that measures almost the whole river before it enters the Volta Reservoir, the flow climbs from a dry-season trickle to a September peak about thirty times larger. The global flood model that produces the five-day forecasts on Ghana's operational warning platform shows almost none of it. Run over the same flood seasons that the local gauge record ends on, it puts the channel near empty right through the wet season, in the exact weeks the gauge is recording the year's peak.
A study published Nov. 5, 2026, in Natural Hazards and Earth System Sciences works out why, and what can be done about it with data anyone can download. Joseph Junior Obeng and three colleagues at the School of Safety Science, Tsinghua University, built a forecasting engine and an alert design for this one river out of free satellite products and the gauge record. Then they spent much of the paper arguing with their own results.
The dam is Bagre, about 180 kilometers north of Nawuni and across the border in Burkina Faso, holding some 1.7 billion cubic meters of water. It was built for irrigation and power rather than flood control, so releases follow storage management rather than downstream risk. A pulse typically reaches Ghana within two to three days, according to a review of flood early warning in the basin published Oct. 23, 2025, in the Journal of Flood Risk Management by Josephine Thywill Katsekpor and three co-authors.
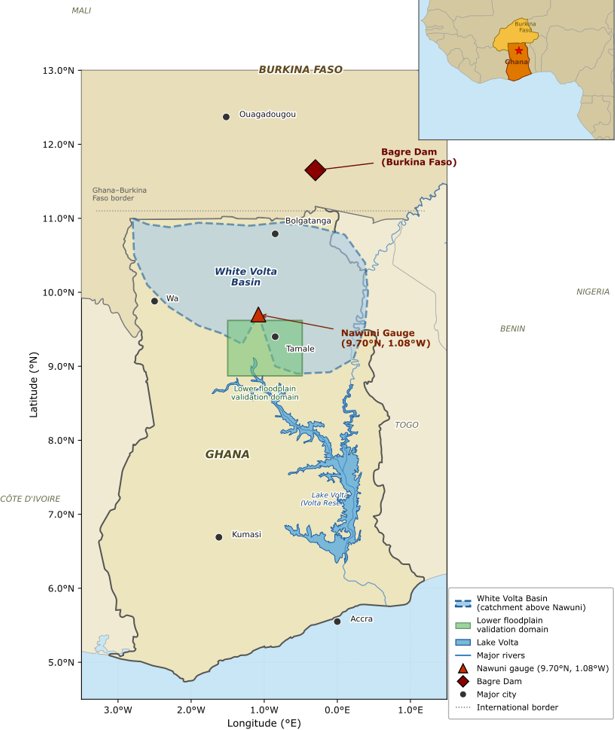
The new paper states the institutional position carefully. The reservoir operator "does not have a formal real-time notification agreement with Ghana's hydrological authorities, though informal communication channels exist." That second clause carries weight. Burkina Faso did announce the spillage that began in August 2026, and Ghana's National Disaster Management Organisation warned communities downstream. What is missing is a binding, real-time obligation Ghana can plan around, which is not the same thing as getting no word at all.
Why the global model misses the river is structural rather than accidental. GloFAS version 4 runs on LISFLOOD, a rainfall-to-runoff model fitted with global parameters and carrying no release rules for Bagre, so it has no way to generate the flood signal that dominates this gauge. Over the team's test window, January 2004 to February 2007, it held the river near zero through the wet season while the gauge peaked between 500 and 1,200 cubic meters a second. On the standard score used to grade a model against a river, where 1 is a perfect match, GloFAS reaches minus 0.526 at Nawuni, worse than assuming the river runs at its long-term average flow. The authors block the general reading of that: it is not a verdict on GloFAS as a global system, they write, but the specific and predictable consequence of applying a globally fitted model with no reservoir-operation rules to a gauge that sits hydraulically downstream of a major regulated dam.
The satellite record had the seasons backwards
The new ingredient is a measure of how full Bagre is, and it comes from a dataset nobody has to pay for: the Joint Research Centre's Global Surface Water maps, built from Landsat pictures, which record where water was seen each month since 1984. The reservoir is, in the authors' words, "a variable that profoundly influences downstream flood risk but has been absent from all previous formal modelling work on this basin."
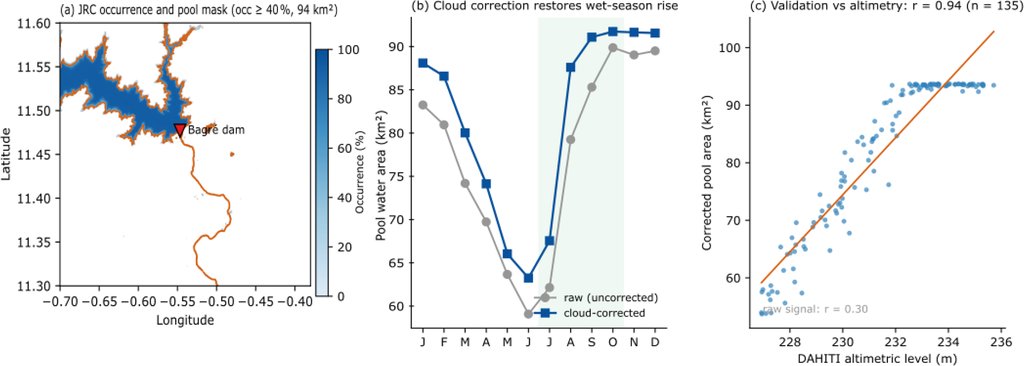
Getting a usable number out of it took two corrections, and that is the most instructive stretch of the paper. The first extraction box, about 3,000 square kilometers, turned out to be roughly a twentieth water: it enclosed the Nakambe valley floodplain and the Bagre Ramsar wetland rather than the reservoir pool. Counting only pixels that hold water persistently shrank the surface to 94 square kilometers, close to the dam's published minimum pool. The second fault was the dangerous one, because it looked like data: the raw monthly series had the seasons inverted, showing the reservoir fullest in the dry months, because wet-season cloud hides water from an optical sensor. Dividing each month by its count of usable observations put the cycle back the right way round. Checked against satellite altimetry, which reads water level by different physics, the corrected pool area tracks the reservoir at a correlation of 0.94 across 135 months. The raw series managed 0.30, and the authors call the cloud correction the decisive step.
What the new variable is actually worth
Then the paper takes its own novelty apart. At one day ahead, in the tree-based model whose weights can be read off directly, a three-day rolling average of recent river flow carries 86 percent of the importance and the previous day's reading another 13 percent, leaving the other nineteen inputs under 2 percent between them. The reservoir index alone comes to less than 0.1 percent. Its correlation with river flow across the training years is 0.037. A model handed the reservoir index and nothing else has no skill at all, and at one day ahead the ensemble does not beat a forecast that simply says the river will do today what it did yesterday.
The authors do not read that as a failure of the idea, and their reason is the sharpest thing in the paper. "By the time a major Bagre release reaches Nawuni it is already encoded in the recent discharge record, making the index redundant for next-day forecasting but potentially informative at longer leads and at the onset of developing events," they write. There is a second reason fullness cannot stand alone: in the years with reliable satellite coverage the corrected pool reaches 98 percent to 99.9 percent of capacity in every wet season, flood year and quiet year alike, so a fullness threshold fires every year, "yielding a probability of detection of 1.0 that is trivial rather than skilful." What the record is kept for is therefore narrow and stated as such: an input to the flow model, a seasonal signal that the reservoir is capable of spilling, and a fallback that keeps producing something when the gauge goes quiet. The monthly maps also arrive two to four weeks after the month they cover, so this is seasonal awareness rather than a live feed.
The scores that need reading twice
The alert half of the system sorts forecast flow into four colored tiers, set from a flood frequency curve fitted to 30 wet seasons at the gauge. Skill at the top tier was measured by retraining the model 21 times, each time holding back one year of record and testing on that year. At one day ahead it caught 0.902 of the days on which the river crossed the top threshold, with false alarms on 0.134 of its alerts. Counted as whole episodes rather than days, it caught six of the seven top-tier floods in the 21-year record at every lead time, with no false-alarm episodes. At five days the detection rate falls to about 0.77, with a range of 0.697 to 0.844, and the range is the honest part: seven episodes in two decades cannot pin a number down tighter than that.
Two things belong in the same breath as those figures. The reserved test years contain no event above the second tier at all, so top-tier skill rests on the year-by-year retraining, which the authors describe exactly: "The LOYO design eliminates training-data circularity but is not equivalent to a fully independent test set." The training record also ends in 1999, which leaves out the largest flood ever measured at Nawuni, in 2007. The second thing is the fit scores. The ensemble reaches 0.984 at one day across the test period as a whole, about as high as river forecasts go, but that period's dry seasons run below 40 cubic meters a second, and on the 55 days when the river ran highest the same ensemble scores 0.808 at one day and 0.248 at five. The paper puts both sets in a single figure panel, which is where they belong.
None of it is running. The forecasting engine has been evaluated; the warning system is a design, and the paper says so in the first person: "We are candid that the present study specifies this people-centered layer as a design and does not evaluate a deployed system." The tiers come with the same caution. They are a statistically grounded starting point for calibration, the authors write, and turning return-period numbers into action levels that mean something in Central Gonja or Savannah district needs co-design with the district disaster offices and the community volunteer networks who would be the ones knocking on doors. The scripts, the derived data and the trained models sit on Zenodo under an open license, so the whole chain can be rerun by anyone with the patience for it.
The claim of a first is the authors' own, and they hedge it themselves: to this basin and, to their knowledge, any comparable West African river system. Every central number in the paper is this one group's work, and the gap between the design and a service is, in their assessment, "a matter of implementation rather than of fundamental capability." The rest of the paper spends its energy the other way, which is what makes it worth reading: a warning system benchmarked against the simplest forecast there is, and reported plainly in the places where the simplest forecast wins.