A Flood That Reversed Chile's Largest River, Rebuilt From the Ground Up

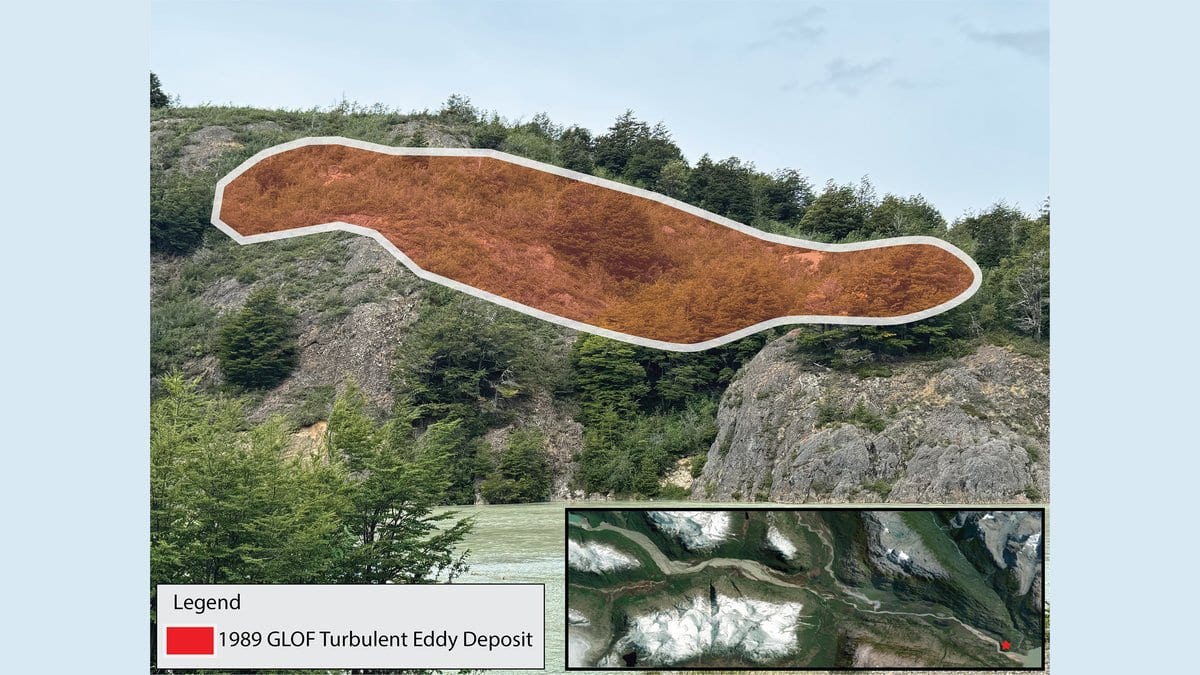
On March 16, 1989, the moraine holding back a small lake on the eastern edge of the Northern Patagonia Icefield gave way, and the water came down Valle Soler so quickly that one of the men working in the upper valley had time only to climb a tree. He went up six to eight meters and spent the night there. The flood destroyed three homes, killed livestock, and for several hours reversed the flow of the Rio Baker, Chile's largest river by volume.
What the flood did not leave was much of a record. It appears in a 1993 bulletin from Chile's national geology and mining service, SERNAGEOMIN, a survey of landslides, debris flows and outburst floods across the whole country, with Valle Soler as one case among many. Working from empirical equations, that bulletin put the peak discharge at roughly 1,800 to 2,000 cubic meters per second. Patagonia has had hundreds of outburst floods in the past century, mostly in valleys with almost nobody in them, and an estimated 15 million people worldwide live where one could reach them.
A study published Oct. 26, 2026, in Natural Hazards and Earth System Sciences, goes back to the valley to find out whether the ground agrees with a much larger number. Jonathan W. Burton and colleagues at the University of Colorado Denver, working with Benjamin Soto Narbona at the Pontificia Universidad Catolica de Chile, had already argued in 2020 that the true peak was nearly an order of magnitude higher, near 20,000 cubic meters per second. That figure is not new, and the new paper uses it as an input rather than deriving it afresh. What is new is the evidence brought in to test it.
The gap is in the rate, not in how much water came down. The bulletin's own estimate of the volume that drained is in fact larger than the volume the reconstruction works from, which is what makes the old discharge figure hard to hold: at the bulletin's rate, draining the bulletin's own volume would have taken about 31 hours, while the witnesses remember the bulk of the flood passing in eight.
Looking for the flood in the ground
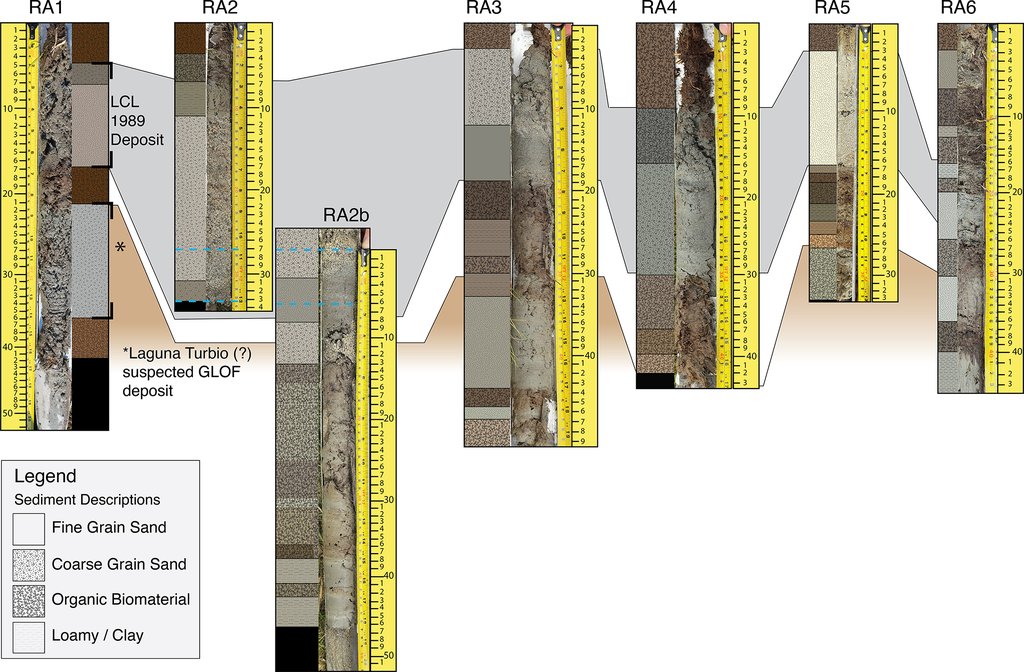
In the austral summer of 2024, the team took sediment cores from the peat wetlands of the lower valley with a hollow steel auger, at sites chosen on criteria fixed before anyone looked at the model output. That ordering carries the weight of the paper. The witness accounts had already gone into the models as inputs, setting the flood's duration and its wall-to-wall behavior, so the testimony cannot then be used to confirm what the models produced; the cores and the scars are the only material that can. Every core held the same thing: a single layer of coarse, silica-rich sand with peat above and below it, fining from sand toward silt downstream. One flood, laid down across the width of the valley.
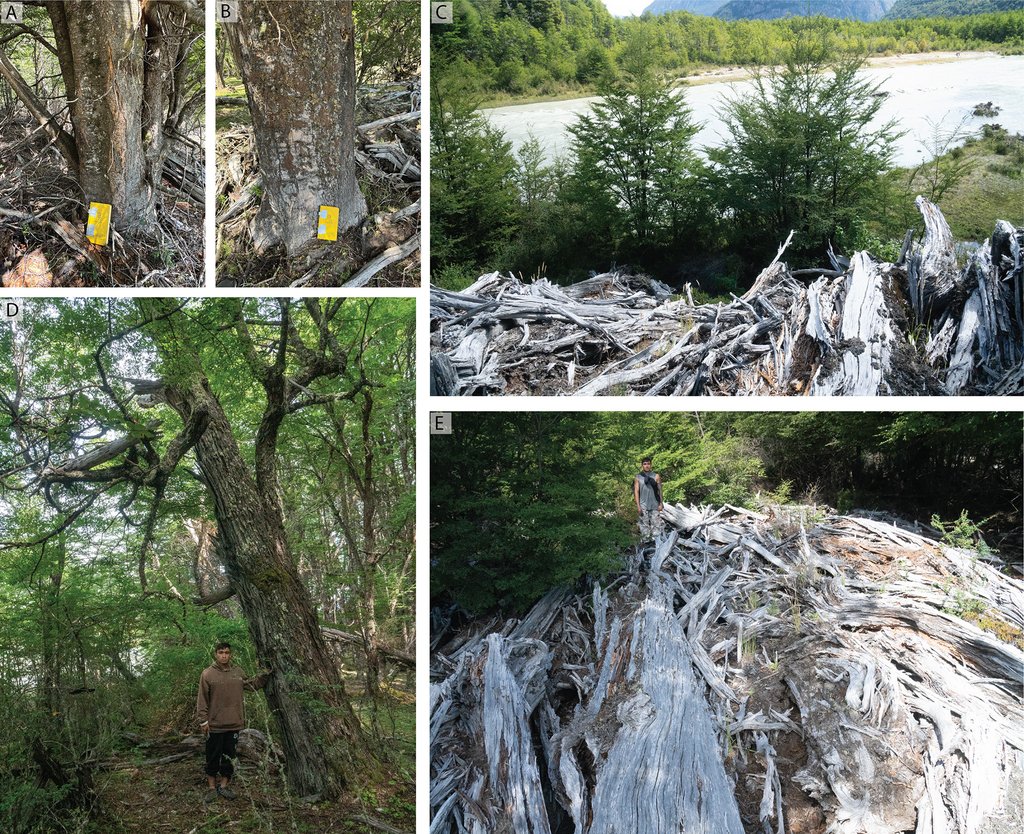
The trees were less cooperative. Fifty cores came out of the southern beeches and none of them dated anything. A fungus common in wet Patagonian forest had hollowed many of the trunks, and the rings that could be measured cross-dated at a correlation of 0.343, far too weak to pin a year on, so the tree-ring arm was dropped. What survived from the trees is cruder and in some ways more useful: scars on the upstream-facing side of trunks, and logs stranded in branches, 3 to 7 meters above today's channel. At the valley's last constriction, where both models pool the water deepest, there is an eddy bar 8 to 12 meters up.
Both models were run over the same satellite elevation data, so that any difference between them came from their structure alone. GeoClaw assumes the dam vanishes at once; the dam-break module in HEC-RAS lets the moraine erode. The wavefront in the instantaneous version arrives 15 to 30 minutes earlier at comparable points downstream, which is a clean measure of what that single assumption buys. Both solve equations that assume clear, Newtonian water, and the upper valley plainly was not that: the flood rolled boulders more than 8 meters across. A dense slurry carries a given depth of flow with less water than clear water needs, so reproducing the observed depths with a clear-water model takes too much discharge. The authors therefore report their reconstructed peak as an upper bound, and say in two places that it is likely an overestimate.
Why the equation broke
Empirical formulas of this kind are built by fitting past outbursts (the volume of water drained and the depth the dam breached to) against the peak flow that followed. The relation used in 1993 ties discharge to drained volume, and the events behind it, cataloged by Clague and Mathews, were ice-dammed lakes. A second widely used relation, from Costa and Schuster, works instead from the potential energy stored behind the dam, and the events it was fitted to held a hundred to ten thousand times less of it than Laguna del Cerro Largo did. Burton and colleagues argue that lakes at the top of the size range need the physics solved rather than the curve extended.
A flood nobody wrote down
In four of the cores there was a second clastic layer below the 1989 one. Satellite imagery had already hinted at a breached moraine at Laguna Turbio, the next lake along, and the field party found the rest of the signature: a lowered lake level, an impact zone downstream, and a band of uniformly small trees where the forest had grown back. Two radiocarbon samples were run and no more, the authors note, because of what they cost. The shallower came back modern, consistent with 1989. The deeper gives a maximum age for the older deposit of about 1899, give or take two decades, from a single sample of bulk carbon. On that reading one small Patagonian valley has taken two large outburst floods in a century, and the earlier one left no written trace at all.
The wider argument the authors make is about what a number does once it is published. Local scientists and officials, they write, were working with figures in the 2,000 to 3,000 cubic meter per second range, citing the 1993 bulletin and the regular ice-dammed outbursts from Cachet II nearby, and they describe that mismatch as a miscommunication with potentially dangerous consequences. The concrete basis for it is a single personal communication recorded during the fieldwork, and the paper examines no hazard plan or policy document, so it stands as the researchers' case rather than a documented history. The reconstruction itself is peer-reviewed, with the referee reports published alongside it, though the model configuration files and input data sit with the corresponding author rather than in a repository, which leaves the event ranked among the largest documented outburst floods in northern Patagonia on a reconstruction nobody else can yet rerun.