Where Emissions Stop Decides How Much Warming Still Comes

Suppose the world's carbon dioxide emissions went to zero overnight: every power station, every engine, everywhere. Does the thermometer stop with them? Climate assessments have mostly assumed something close to yes, a little warming still working its way through the system and a little cooling to set against it. That assumption rests on experiments run at the cooler end of the range, and nobody had checked what happens if the world stops higher up.
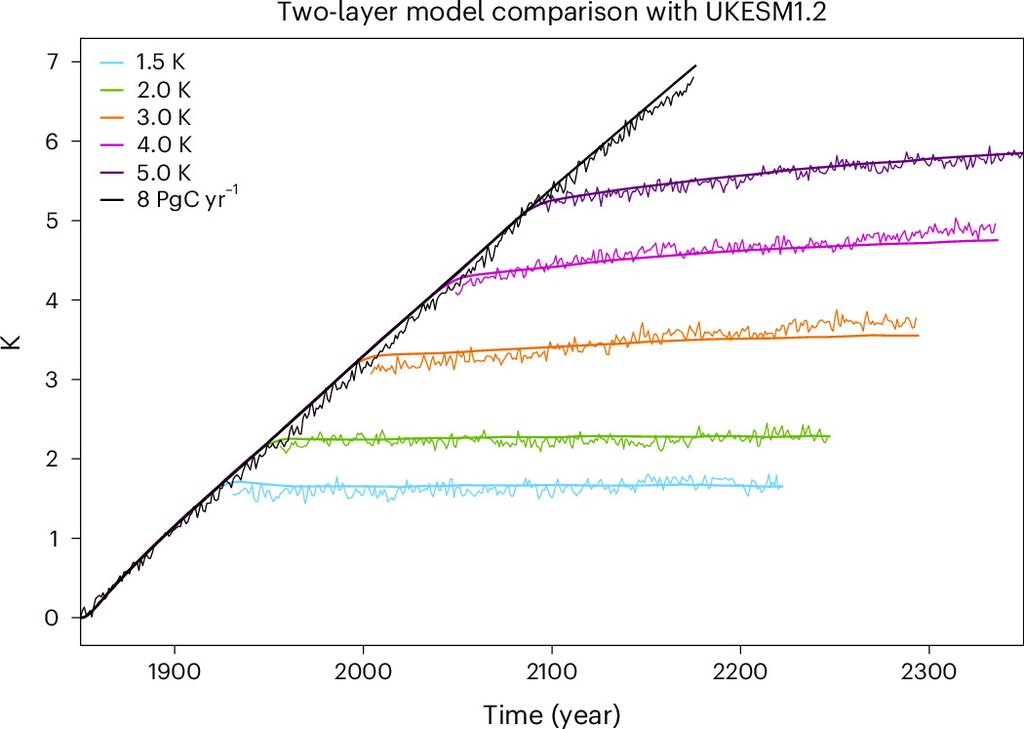
In one model it does not. Laura Gibbs and colleagues at the Met Office Hadley Centre ran the UK Earth System Model up a steady emissions path, then cut its carbon dioxide emissions to zero at five points along the way, from 1.5 °C of warming to 5 °C. Each of those worlds was then left to run on for about 300 years with nothing emitted at all. The work was published Nov. 3, 2026, in Nature Climate Change.
The design is deliberately artificial. Emissions rise at a constant rate, fast enough to warm the world by about 0.2 °C a decade, and then stop dead in a single year. No real path to zero looks like that, and the authors say plainly that different paths may give different answers.
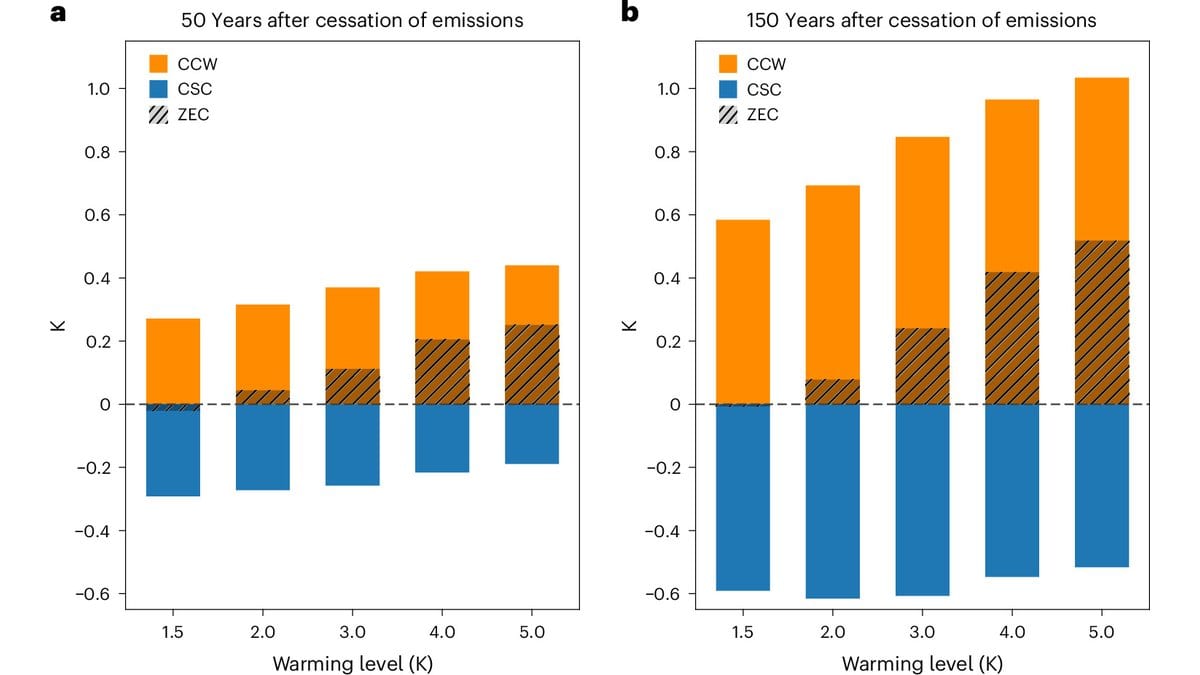
Up to 2 °C the model behaves as the assumption expects: the leftover warming, which researchers call the zero emissions commitment, stays close to zero. Switch the emissions off higher and the temperature carries on climbing at roughly 0.15 to 0.2 °C a century, for as long as the runs continue. By 150 years after the halt that adds up to 0.4 to 0.6 °C for the stops at 3 °C and above. The spread there is not an error bar. It is the gap between the stopping points, the larger figure belonging to the hotter ones.
A tug of war that is even, until it is not
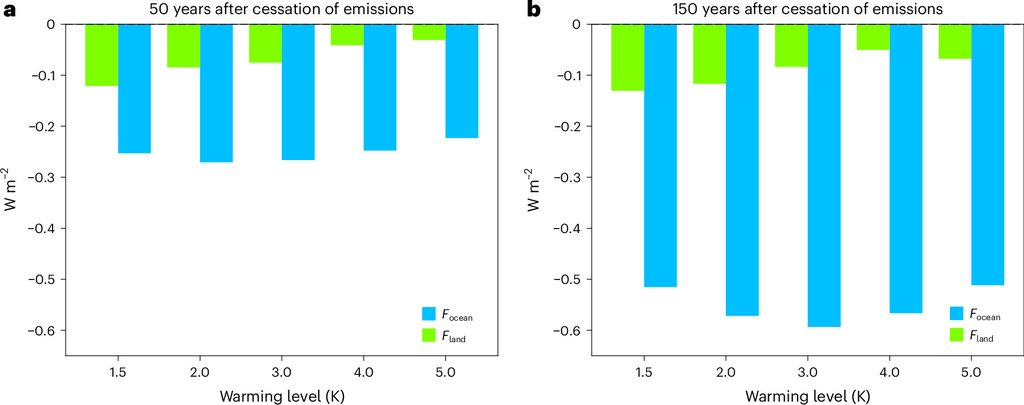
The authors pull the result apart with a simple model of heat moving in and out of the ocean and atmosphere, and what it shows is a tug of war. When emissions cease, the air still holds the carbon dioxide already in it, and the ocean is still catching up on the heat that gas has trapped, so warming continues. Meanwhile forests, soils and seawater go on drawing carbon dioxide out of the air; the heat being trapped eases, and that cools. At the lower stopping points both sides are almost exactly equal and opposite. They stop matching as the peak rises: the warming side strengthens, because a world that took longer to heat up is further from balance, and the cooling side weakens.
The cooling side weakens through diminishing returns, on land first and then at sea. The land's share of the drawdown shrinks as the peak rises, and in this model the slowdown sets in above 2 °C. Vegetation stops building up carbon as quickly, and in the hottest runs soils tip from storing carbon to giving it back. In the decades after the halt the land takes up less than half as much carbon at the hottest stop as at the coolest. The ocean keeps absorbing, and over the longer run it does almost all of the work, but its payoff shrinks too. Carbon dioxide's warming effect does not rise in step with how much of it is in the air, so taking a metric ton out of a crowded atmosphere buys less cooling than taking a metric ton out of a thinner one.
The highest step tested, not a line that was found
That makes the 2 °C figure worth reading carefully. The runs step from 2 °C straight to 3 °C, so what they can say is that the commitment was still near zero at the highest level tested and clearly positive at the next one up. Where in between the turn happens is unresolved, and the paper puts no uncertainty range on it, because this is a temperature the experiment picked rather than a number it fitted. Nor is the figure arbitrary: in this model the land's slowdown begins above that same temperature.
What one model settles, and what it does not
This is one Earth system model rather than a set of them, and that distinction carries most of the weight here. Each warming level was run three times. The three differ only in the climate's own year-to-year noise, which shifts the commitment by about 0.1 °C, so they measure weather rather than disagreement between models.
Across models the picture is different. A 2020 comparison of 18 Earth system models, each running the same kind of abrupt halt, put the commitment 50 years on anywhere between −0.36 and +0.29 °C. The average across them was −0.07 °C, slightly on the cooling side of zero. The authors are candid about that: an earlier version of their own model sat at the top of the range the IPCC assessed, and the size of the numbers here may partly reflect the model's own behavior. What these runs establish is how one model behaves. Whether the Earth behaves the same way is a different question.
The dependence on warming level does have support elsewhere. Runs with an Australian Earth system model held at a series of temperatures, published in 2024, found regional changes continuing for centuries after emissions ceased, and growing stronger the higher the level at which they stopped. What nothing yet corroborates is the size of the effect.
A commitment near zero is also a narrower statement than it sounds. It is about the global average air temperature and nothing else: sea level goes on rising, ice sheets keep adjusting, and in the Australian runs the Southern Ocean kept warming for centuries after emissions ended.
What the work hands the people who compile carbon budgets is a caution about a shortcut. Where a carbon budget assumes the leftover warming is about zero, this model supports the assumption up to 2 °C. At higher peaks it suggests the assumption may understate what is still coming, so a figure for the commitment should carry the temperature and the time horizon it belongs to. The group intends to repeat the analysis on the multi-model experiment its runs belong to, once those results are available. Their own conclusion, if the pattern holds, is that the higher the peak a world passes through, the more carbon it has to take back out to come down again.