Skip to content
See the World Through ScienceA project of ALLATRA
Source: Peer-reviewedNature1 source

New Map Shows Where Africa's Water Goes, and Who It Never Reaches
Environment

Republish this story

Our work is licensed under Creative Commons BY-NC 4.0. You may republish this piece for free — with credit to ALLATRA Media and a link to the original, unedited beyond length trims, and not for commercial use.

Read the full license

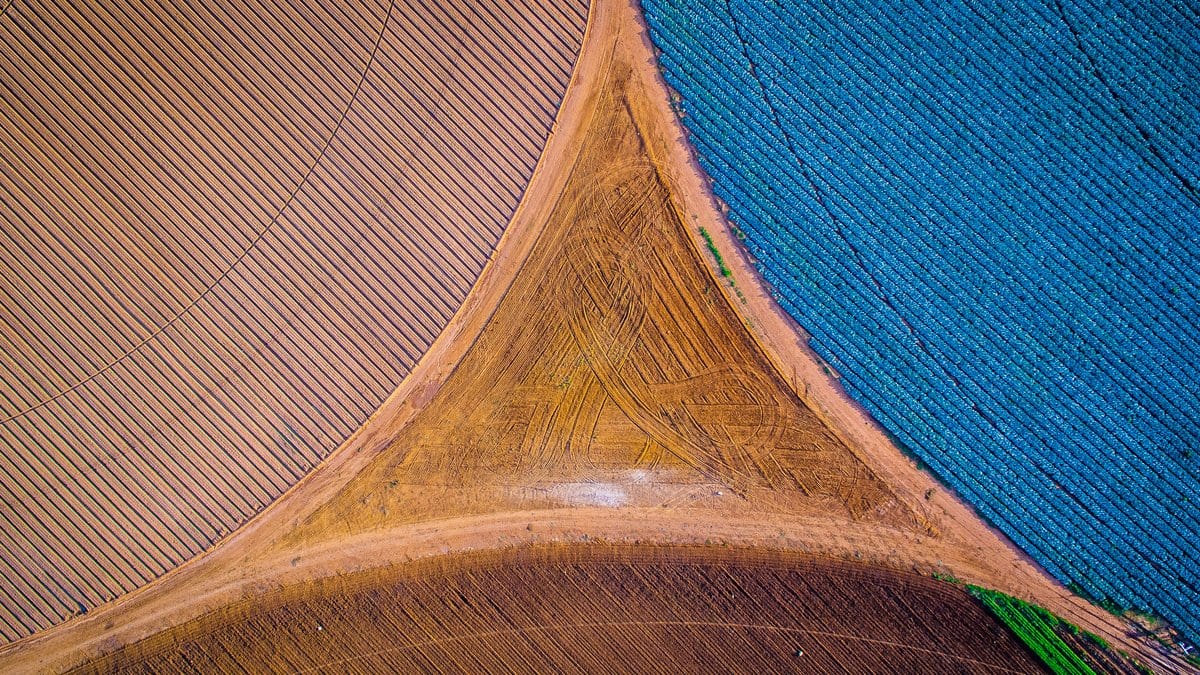
Aerial view looking straight down on farmland where three large circular irrigated fields meet, one plowed brown, one blue green with crops and one pale pink.
Three watered fields meet at a wedge of bare earth, photographed from the air Sept. 26, 2015. In parts of southern Africa the water asked of a basin already exceeds what is there (illustrative)."Crop Triangle South Africa" by Eddie Oosthuizen, via Wikimedia Commons, CC BY-SA 4.0

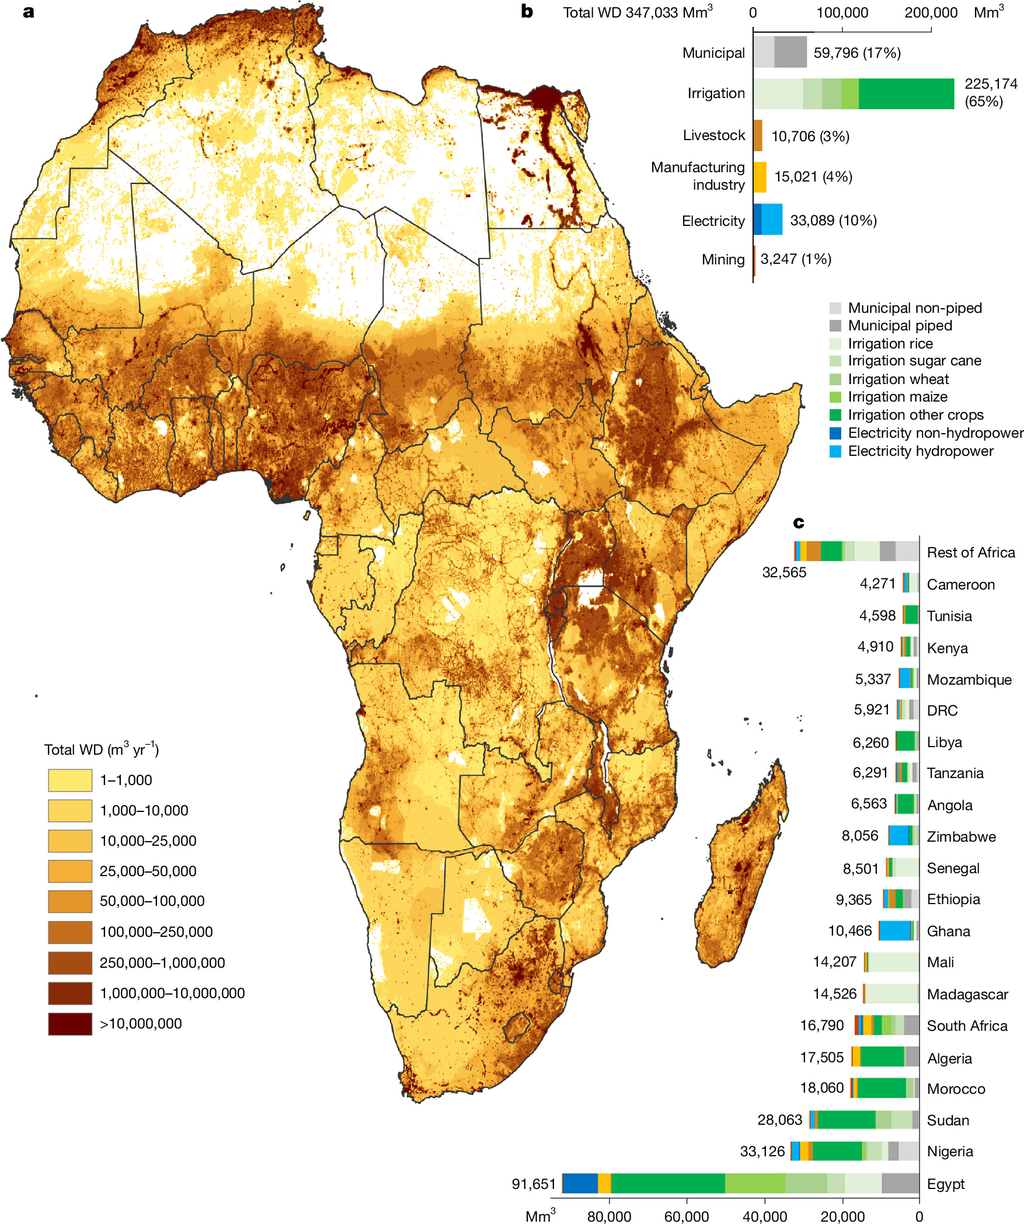
Researchers at the International Water Management Institute have estimated Africa's water demand sector by sector across the whole continent, a breakdown the paper says had not been mapped in detail before. Davy Vanham and colleagues put total demand for 2020 at 347 cubic kilometers a year, with irrigated farming taking 225 cubic kilometers of that, or 65%.

The assessment, published in Nature on Oct. 28, 2026, is offered as a baseline for finding where demand presses hardest and where people cannot reach a supply, "rather than establishing a new causal mechanism of water insecurity." The authors write that the figures should be read as harmonized estimates and not as direct observations of water actually used.

Demand grew 26% between 2010 and 2020, the paper reports. Towns and cities came second to irrigation, ahead of electricity generation, manufacturing, livestock and mining. Egypt has the highest national demand, followed by Nigeria, Sudan and Morocco.
A map of Africa shaded from pale yellow to dark red for water demand in each grid cell, with bar charts of demand by sector and by country beside it.
Panel a maps total water demand across Africa for 2020 grid cell by grid cell; panels b and c break the 347 cubic kilometer total down by sector and by country. Fig. 1 from Davy Vanham, Dahami Gunathilake, Bhawani Gunasekara, Seifu Tilahun, Youssef Brouziyne, Fasikaw A. Zimale, Monika Rawat, Raphael Vanham, Mohammed El Hafyani, Asma Thowfeek, Sithara Kumarasinghe, S. D. Vaca-Jiménez, P. W. Gerbens-Leenes, Simon Langan (2026), "Spatial and sectoral water demand assessment for the African continent", Nature — CC BY 4.0, resized

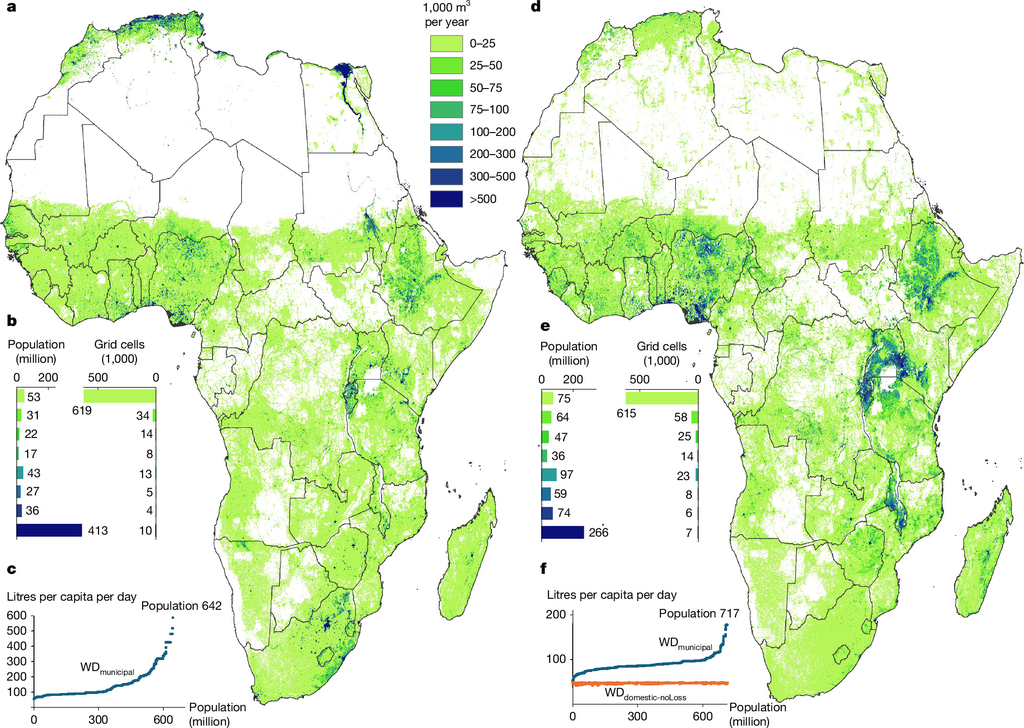
The authors also counted who can turn on a tap: 717 million Africans had no piped water at home. What that group needs is largely absent from official water-use statistics, which record the water people draw rather than the water they would use if it reached them.
Two maps of Africa in green and blue shading for municipal water demand, one for piped supply and one for non piped supply, each with population charts beneath.
Municipal water demand where supply is piped (panels a to c) and where it is not (panels d to f). The authors count 717 million people in the second group. Fig. 2 from Davy Vanham, Dahami Gunathilake, Bhawani Gunasekara, Seifu Tilahun, Youssef Brouziyne, Fasikaw A. Zimale, Monika Rawat, Raphael Vanham, Mohammed El Hafyani, Asma Thowfeek, Sithara Kumarasinghe, S. D. Vaca-Jiménez, P. W. Gerbens-Leenes, Simon Langan (2026), "Spatial and sectoral water demand assessment for the African continent", Nature — CC BY 4.0, resized

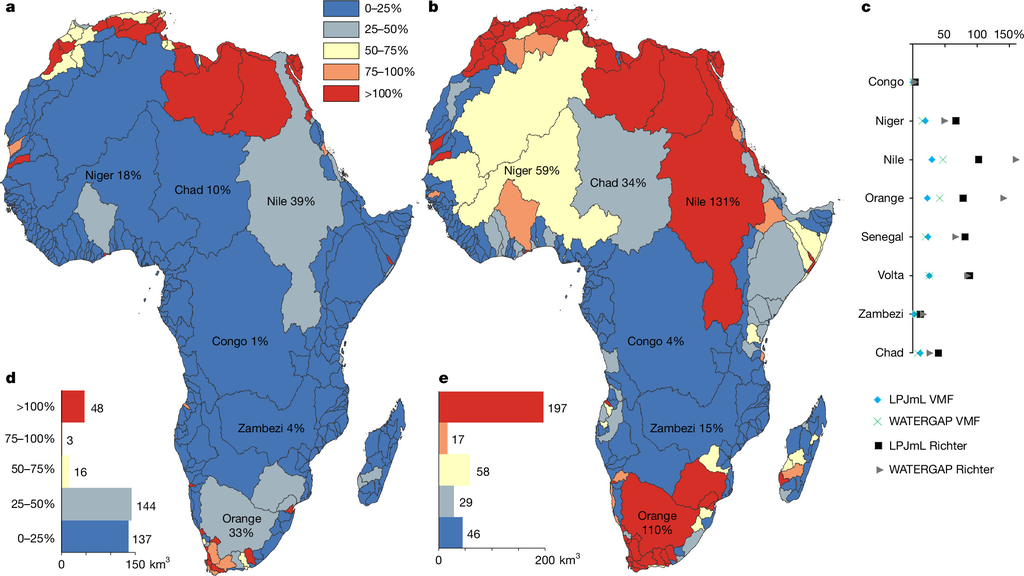
How demand sits against supply varies sharply by region. In parts of northern and southern Africa the estimated demand exceeds the water available, the authors report, though that comparison shifts with how much water is reserved for rivers and wetlands. Elsewhere there is more water than demand and still no pipe to carry it: "physical availability alone does not determine water security."
Two maps of Africa with river basins colored from blue to red by the share of available renewable water that demand takes up, with bar charts of the totals.
Each river basin colored by the share of its renewable water that demand takes, under two different ways of reserving flow for the environment (panels a and b). Red marks basins above 100 percent. Fig. 6 from Davy Vanham, Dahami Gunathilake, Bhawani Gunasekara, Seifu Tilahun, Youssef Brouziyne, Fasikaw A. Zimale, Monika Rawat, Raphael Vanham, Mohammed El Hafyani, Asma Thowfeek, Sithara Kumarasinghe, S. D. Vaca-Jiménez, P. W. Gerbens-Leenes, Simon Langan (2026), "Spatial and sectoral water demand assessment for the African continent", Nature — CC BY 4.0, resized

Only open-access input data went into the assessment, and the datasets behind it are posted on Zenodo. The paper itself is open access.

Sources

Spot an error?

Spot an error?

Report an error

Spotted a mistake on this page? Tell us what's wrong and our editors will take a look.

What kind of problem?

Only if you'd like us to be able to follow up. We won't use it for anything else.

We correct mistakes openly. Select any text to flag it. Fixes are logged under our Corrections Policy.

Report an error

Reporting on

New Map Shows Where Africa's Water Goes, and Who It Never Reaches

What kind of problem?

Only if you'd like us to be able to follow up. We won't use it for anything else.

We read every report. Corrections are logged publicly.