The Mediterranean Wore This Shape of Heat Before. The Sea Under It Was Cooler.

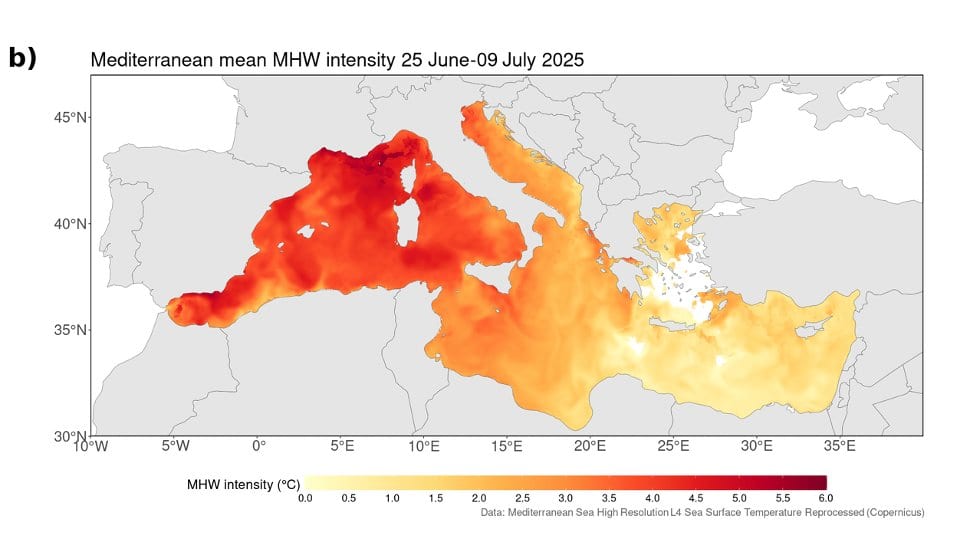
The Mediterranean has a shape it falls into when it overheats. The warmth banks up in the west, between the Gulf of Lions, the Balearic Sea and the waters around Corsica and Sardinia, and thins toward the east. In the last days of June 2025 the sea took that shape again. Davide Faranda, of the Laboratoire des Sciences du Climat et de l'Environnement near Paris, and four colleagues went looking through 75 years of records for the other times it had.
The event itself was never in question. On a Copernicus Marine satellite record, the sea in the western basin locally ran more than 4.5 °C above the 1991–2020 average for the time of year, and the daily sea surface temperature, averaged across that whole western basin, "reached its maximum close to 28 °C in early July," the team writes in Natural Hazards and Earth System Sciences, where the study appeared Oct. 30, 2026. It was a long event as well. Francisco Pastor and Samira Khodayar, two of this paper's five authors, had earlier put the average Mediterranean marine heatwave at 16 days; this one held the western basin above the heatwave threshold from early June to late July.
Looking for the last time the sea did this
The search ran on ERA5, a model-assembled record of past weather that anyone can download free from Copernicus. The team averaged the sea's departure from its seasonal normal over the last 11 days of June 2025, drew a box around the western and central Mediterranean, and asked of every June-to-September day since 1950 how far its pattern sat from the 2025 one. Rank the days by that distance and the closest are analogues: look-alikes, matched on the sea's own pattern rather than on the weather above it. Most analogue studies match the atmosphere first. Matching the sea was the choice that suited a marine event.
The team kept the 42 closest days in each of two stretches of the record, 1950–1986 and 1987–2024. The split year sits close to a documented acceleration in Mediterranean warming and cuts the record into two samples of about the same size. It is also not a pre-industrial baseline, and the authors say so flatly: the earlier stretch is simply a cooler segment of the same observational era, cooler perhaps because western Europe's air carried more pollution particles then, perhaps because a slow Atlantic cycle sat in a different phase.
Both sets of look-alikes, old and recent, reproduced the broad geography of 2025, with more warmth in the west than in the east. The 2025 pattern, the authors write, is "not unprecedented in terms of its large-scale spatial organization." That is a statement about the shape, not about the event, and the paper bounds it at once: judged by how close its best matches are, "the event is only partially captured even by its best historical analogues."
Where the two eras parted
Averaging each set and subtracting one from the other is where the comparison pays off. Over the grid points where the gap survived a resampling test, the sea in the recent look-alikes ran +1 to +1.5 °C warmer than in the older ones across broad sectors of the western Mediterranean and parts of the Adriatic. Air temperature over the surrounding land moved further still, locally +1.5 to +2.5 °C over the Iberian Peninsula, southern France, Italy and the Balkans. More sunlight reached the surface over much of the basin. Those three moved together, and that is the finding.
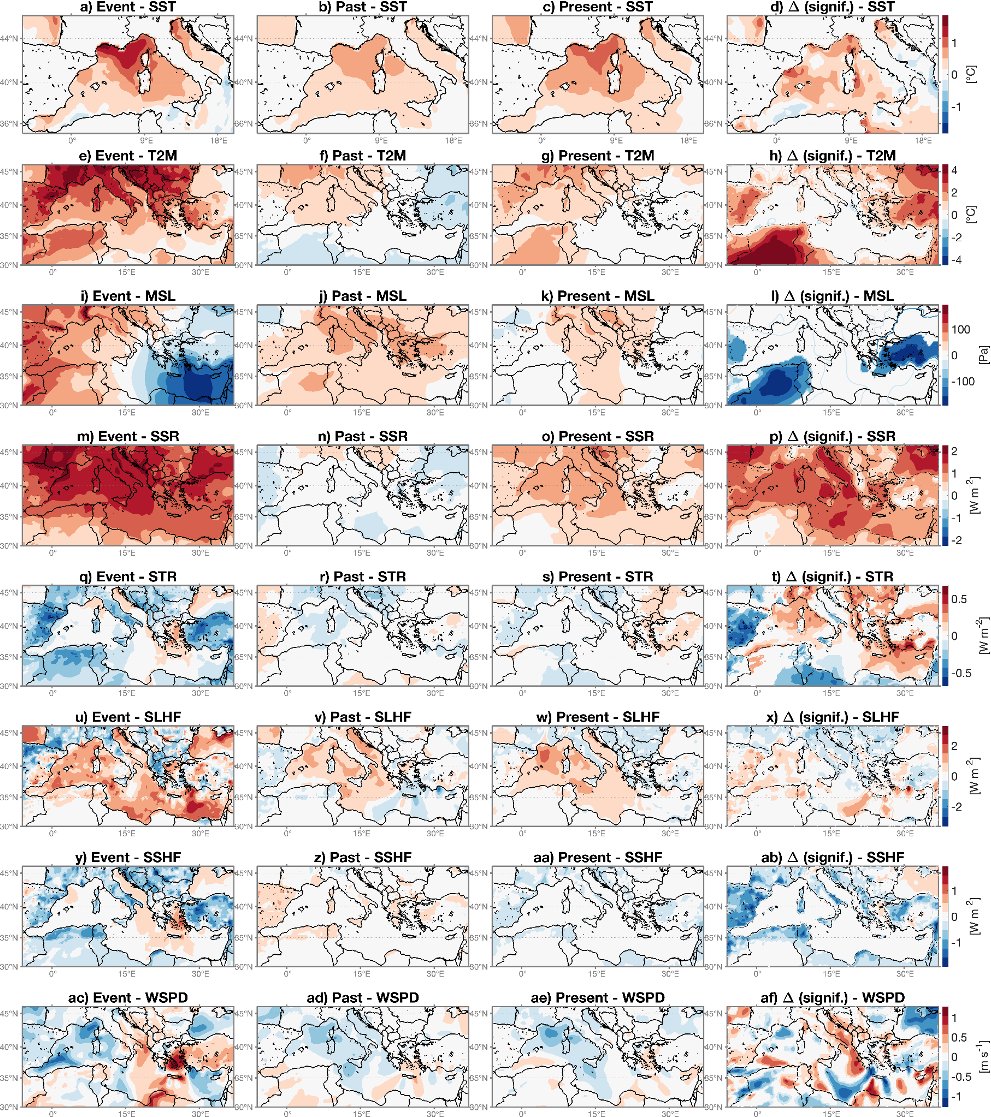
That +1 to +1.5 °C is a difference between two sets of days inside one record, not a departure from a climate baseline, so it cannot be stacked on top of the 4.5 °C above. Nor is it a share of the 2025 heatwave handed to human warming. The figures are conditional metrics, the authors write: "they describe the typical shift of the thermodynamic environment in which SST patterns analogous to the June 2025 event occur, and not as a probabilistic attribution estimate of the human contribution to the 2025 event itself," and they are given "as ranges rather than as point estimates" because natural variability can contribute too.
The fields that describe the weather behaved differently. Sea level pressure, wind speed and the two turbulent flows that shuttle heat between sea and air came out weaker, patchier and often not significant. The easy reading is that the weather patterns themselves have not changed, and the paper shuts that door: "internal variability is only one of several plausible readings," the authors write, listing a spatially complicated atmospheric response, real circulation changes too small to see against the noise in 42 dates, and regional effects such as land-sea temperature contrasts, winds steered by mountains and coastal upwelling as equally live candidates. Telling them apart, they add, would take large model ensembles.
Why the authors stop short of the word caused
The abstract carries the boundary in one sentence: "Since the analogue framework cannot fully separate externally forced trends from internal variability and it does not explicitly resolve ocean dynamical processes, these results do not constitute a complete formal attribution on their own." The strongest claim in the paper is the sentence straight after, that the analysis "supports the interpretation that long term warming contributed substantially to the intensity of the 2025 Mediterranean marine heatwave." The paper is peer-reviewed and open access, and it stops there deliberately.
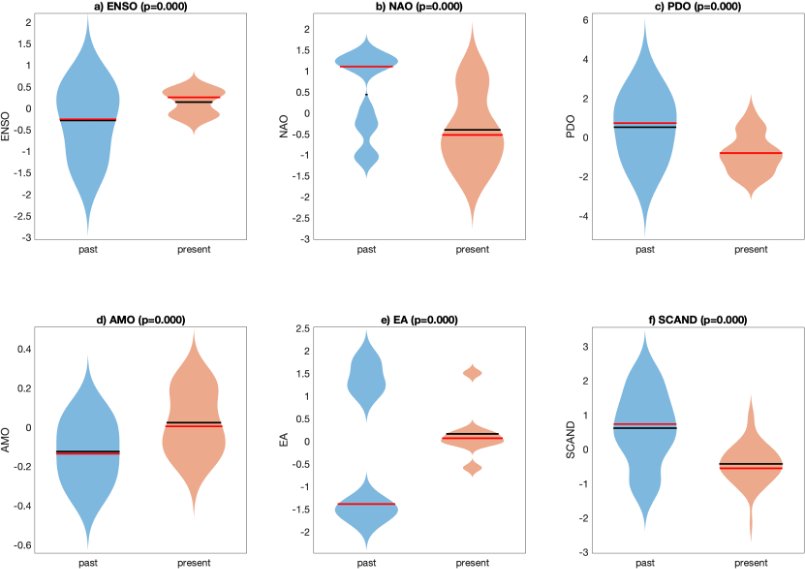
Two of its own limits say why. The box the search was drawn over, roughly from Gibraltar to the Adriatic, is an expert choice, and the method is known to be sensitive to where that boundary is put, so the result is not independent of it. And six standard indices of large-scale ocean and atmosphere variability, El Niño among them, come out significantly different between the old and the recent look-alike days. The authors call that purely descriptive, and are clear that it does not show any of those modes causing the 2025 event. It does mean the two sets of days sit in different slow-moving climate states, which is why the forced warming and the natural swing cannot be split apart here.
The method produces a picture rather than a verdict. Because the sea's pattern is held roughly fixed, the comparison returns a variable-by-variable, grid-point account of which parts of the surface energy budget have moved and which have not, all from observations rather than simulations. "The aim is not to replace formal probabilistic attribution studies based on climate model ensembles," the authors write; the two are meant to be used together, and this one can be run within weeks of an event. The analysis is built on the openly published ClimaMeter code from Faranda's group, though the study's own scripts are available from the authors on request. That Mediterranean marine heatwaves are intensifying is not in dispute: Dimitra Denaxa and colleagues assessed it for Copernicus Marine's Ocean State Report, and Copernicus's European State of the Climate records the whole basin under at least strong marine heatwave conditions in every year since 2023. What this paper adds is a measurement of the water those events now land in.