The Warming Gap Between Rich and Poor Places Outlives Net Zero

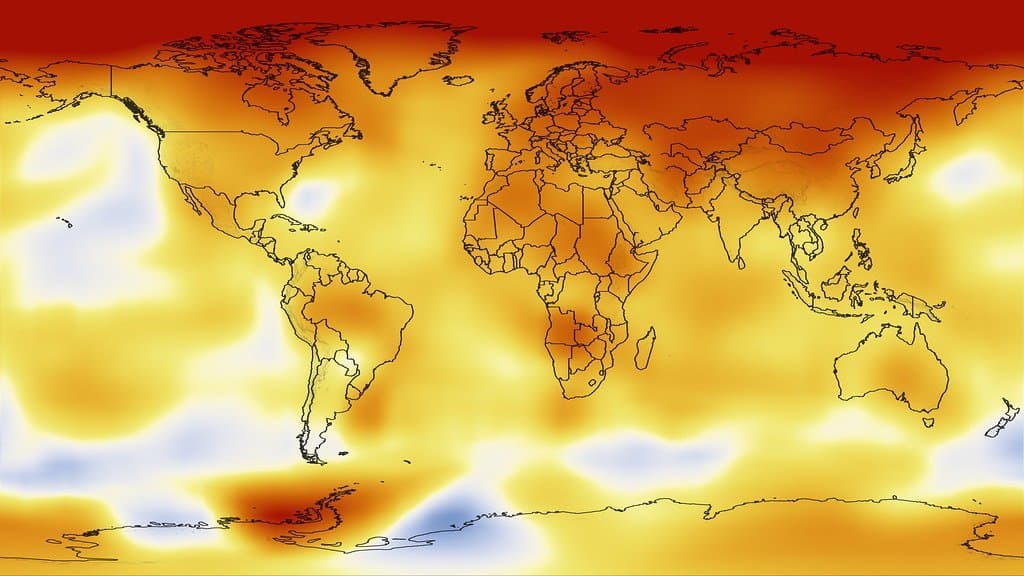
Net zero is usually drawn as a finish line. Emissions come down, the line touches zero, and the graph of global temperature flattens out. What that picture leaves out is that the world never warmed as a single object, and it will not stop warming as one either.
A group at the University of Melbourne set out to see what the map of local temperature does on the far side of that line, and how much trust the answer deserves. Led by Andrew King, the team put the question to several modeling frameworks rather than to one, then asked who lives in the places where the change shows up. Their paper appeared Sept. 16 in Environmental Research Letters.
The answer comes with a qualifier that carries the whole result. The team did not measure each place against a thermometer. They measured it against the global average. Read that way, a distinct pattern appears: the Northern Hemisphere cools and the Southern Hemisphere keeps warming, a pattern that holds across the different frameworks and across the timeframes analyzed.
What that means is that the two halves of the planet part company. The south runs ahead of the global number; the north falls behind it. It is not a claim that thermometers in Canada or Europe start reading lower, and the study does not make one. It is a claim about which places move faster than the world as a whole, and these findings represent model results rather than a record of observed historical changes.
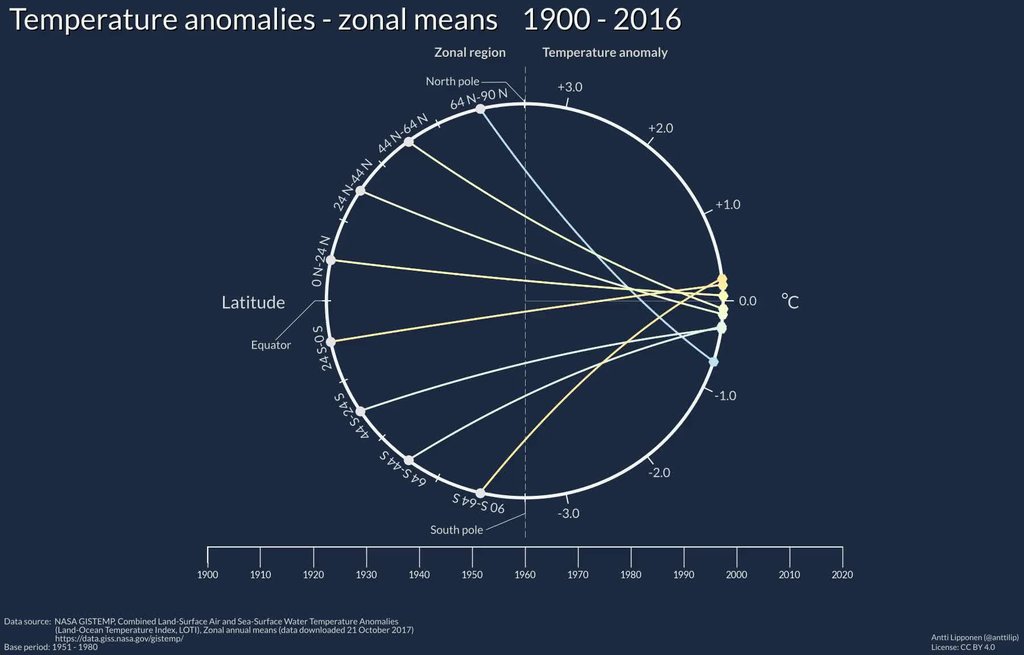
The broad reason is familiar from any climate textbook. The southern half of the planet is mostly ocean, and water gives up heat far more slowly than land does. What the new study adds is not that explanation. It is the finding that the pattern survives being put to more than one model.
The second result is about where anyone would notice. The team compared the size of the temperature change at each place with the size of that place's ordinary year-to-year swings. By that measure, change after net zero, whether warming or cooling, stands out most in the tropics. The logic here is easy to reverse: it is not that the temperature change in the tropics is the largest, but rather that tropical weather varies so little from year to year. A small shift there is unmistakable against such a steady background, while a much larger change in regions with wilder year-to-year swings can be harder to detect.
That is also the shape of today's unfairness. Warming measured against a place's background swings is already higher in poorer tropical regions than in wealthier high-latitude ones. The team found that this inequality does not reverse under net-zero pathways. Under net-negative pathways, where carbon dioxide is actively pulled back out of the air, they note that it may take many decades to begin to reverse. To begin, not to finish.
None of this is a forecast for the 2050s. King's group put a timescale on the hemispheric split in an earlier paper, published in Earth's Future in December 2025: after net zero, it becomes detectable at many locations within a few centuries. Centuries.
The claim the new study makes for itself is robustness. The pattern turns up across several modeling frameworks, not only in one set of runs. Agreement between climate models about particular regions is not something the field has. In 2022, an independent team led by Andrew MacDougall examined nine of the full-scale models used for climate projections, all of which had run the same standardized experiment on what the climate does once carbon dioxide emissions cease. At the regional scale, the simulated patterns showed little consistency between models. The pattern, magnitude and sign of the changes remain highly uncertain.
The two results are not in conflict. MacDougall's group was looking at absolute change region by region, while the Melbourne team described a hemispheric pattern measured against the global average, the exact framing in which a signal can survive underlying model disagreements. However, this robustness belongs solely to the new study; it is not a verdict the models have reached together.
Taken together, the overall picture differs from what a simple finish line suggests. Reaching net zero stops the warming from growing. Based on these simulations, it does not distribute temperature relief evenly, nor does it prioritize the regions where warming already stands out most sharply. The world that arrives at net zero looks, for a long time afterward, a great deal like the world that got there.
Sources
- Environmental Research LettersPeer-reviewed
- doi.org
- doi.org