The Worst Heatwaves Are Still Ahead, Even if Emissions Fall


A record is an awkward thing to plan around. It tells you what has already happened in one place, and nothing at all about how much room is left above it. Recent years have supplied a great many heat records, and the people who design hospitals, power grids and water systems have had little choice but to read them as a ceiling.
The study comes from Philipp Aglas-Leitner, a physicist at Freie Universität Berlin, with Sarah E. Perkins-Kirkpatrick of the Australian National University and five colleagues. It sets out to measure the room above the records. Their paper, published Nov. 5, 2026, in Nature Communications, takes 22 observed terrestrial heatwaves, picked for their reported impacts or their record-breaking nature, and puts a blunt question to the climate models. For the rest of the century, how often does a model produce an event in that same region worse than the one that actually happened? Nine regions get the close treatment, among them Europe, Northeast Siberia, Australia, India and Pakistan and the Pacific Northwest of the United States and Canada.
The answer, in the paper's own words, is that "a considerable percentage of future heatwaves are projected to become longer, larger, more severe and to generate more cumulative heat than most exceptionally high observed reference heatwave characteristics." That holds under low, intermediate, high and very high emissions scenarios alike. The authors end with a sentence unusually flat for a modeling paper: "We demonstrate that the worst heatwaves are yet to come, even in a low-emissions future."
Six months is the length of the season, not a forecast
The number from this study that will travel furthest is the longest one. Under SSP1-2.6, the strong mitigation pathway, the models produce heatwaves running up to several months, with five of the nine regions showing events "approaching or even hitting the theoretical maximum length of six consecutive months." The second half of that phrase matters as much as the first. Projections were computed for each region's warmest six months, so that span is the whole window the analysis looks through. An event that fills the window cannot be recorded as anything longer, and hitting the maximum means the entire analyzed season counted as one heatwave.
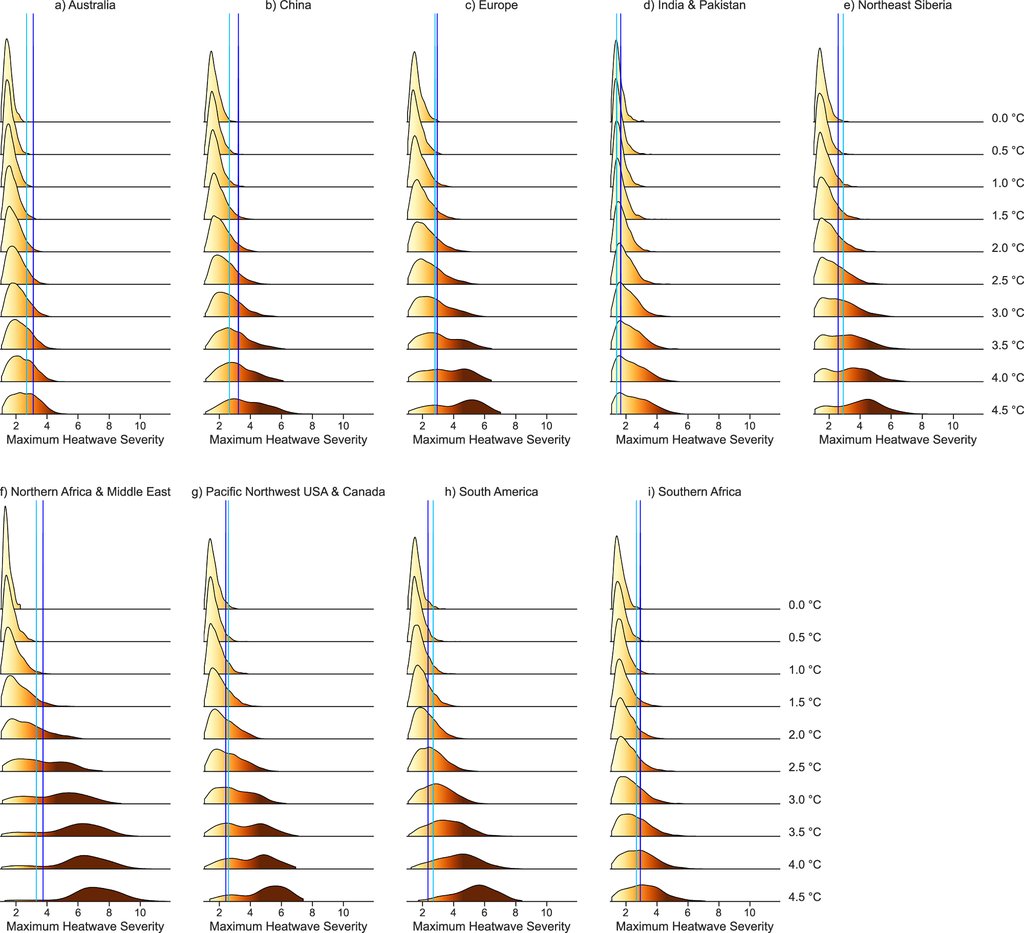
A separate and stronger claim in the paper belongs to the high-emissions scenarios, and the two should not be run together. Under those pathways, Australia is the only region whose longest projected heatwave stays below six months.
The threshold is pinned to a mid-century climate, on purpose
A heatwave here is a run of at least three days in which the region's area-weighted average daily high clears the temperature typical of the hottest tenth of days for that date on the calendar. The climate it is measured against does not move: the threshold comes from a fixed 1961 to 1990 base period, held still while the models warm around it. That choice does much of the work in the months-long figure. In a hot enough world an ordinary summer day can sit above a mid-century threshold for weeks on end, so a very long heatwave in these projections is substantially a statement about a shifted average climate, measured against an old yardstick, rather than months of weather a future resident would experience as a shock.
The fixed baseline was chosen deliberately and defended in the open. The human body has physical limits on heat tolerance, the authors note, which bounds how far anyone can get used to a warmer world. And a moving baseline "would smooth out any such changes by constantly shifting the climate against which heatwaves are measured towards increasingly warmer background conditions." The models themselves were screened before any of this: each was ranked by how closely it reproduces observed extreme heat, and the worst quarter of each archive was thrown out.
The small percentages point the other way
Most of the projected heatwaves are nothing like that long, and the paper's own percentages say so. Under the strong mitigation pathway, roughly 6% to 11% of projected heatwaves in Europe, India and Pakistan, and northern Africa and the Middle East outlast the long observed event used as their region's reference, and about a quarter do so in Northeast Siberia. The months-long cases sit at the far end of a pool that holds every event the models produce for the rest of the century, scored as an average across a large box of latitude and longitude. They are the tail of a distribution, not a typical future summer, and not a forecast for any one city.
The small numbers in the paper are the ones most easily turned upside down. The Australian and Chinese record events in the set are exceeded in median severity, meaning the intensity of a typical day of the event, by fewer than 3% and fewer than 0.5% of projected heatwaves under strong mitigation. Read as reassurance, that is backwards. "These relatively low exceedance percentages highlight the exceptional median severity of these events," the authors write. The observed events were extreme enough that even a warming century rarely beats them on that one measure. The paper's use of exceptional is narrow: it defines the word as a statistical label for a characteristic that reaches a very rare level in the record, not as a judgment about a heatwave.
A projected event that outruns an observed one will not necessarily do similar or worse social and economic damage, the authors caution. That depends on how far and how fast people and systems adapt, and even on when in the season the heat arrives. The death tolls and damage bills attached to the recent record events cannot simply be carried forward onto a model's output.
The temperature records behind the study are public: Berkeley Earth's gridded station data, the ERA5 reanalysis of past weather and the standard archives of climate model runs. The data needed to redraw the figures and the full analysis code are available from the first author on request, with demo versions of the central scripts deposited on Zenodo. Holding warming near the Paris Agreement's 2 °C target, the authors write, would give only limited protection against heat of this kind. Their last point is about planning horizons rather than emissions: adaptation and mitigation measures are generally tailored to the events of current lifetimes, and the gap will keep widening until planning reaches past them.
Sources
- Nature CommunicationsPeer-reviewed
- idw-online.de
- Zenodo