The Ice Shelf Decides Where Its Meltwater Flows. Summer Decides How Much.

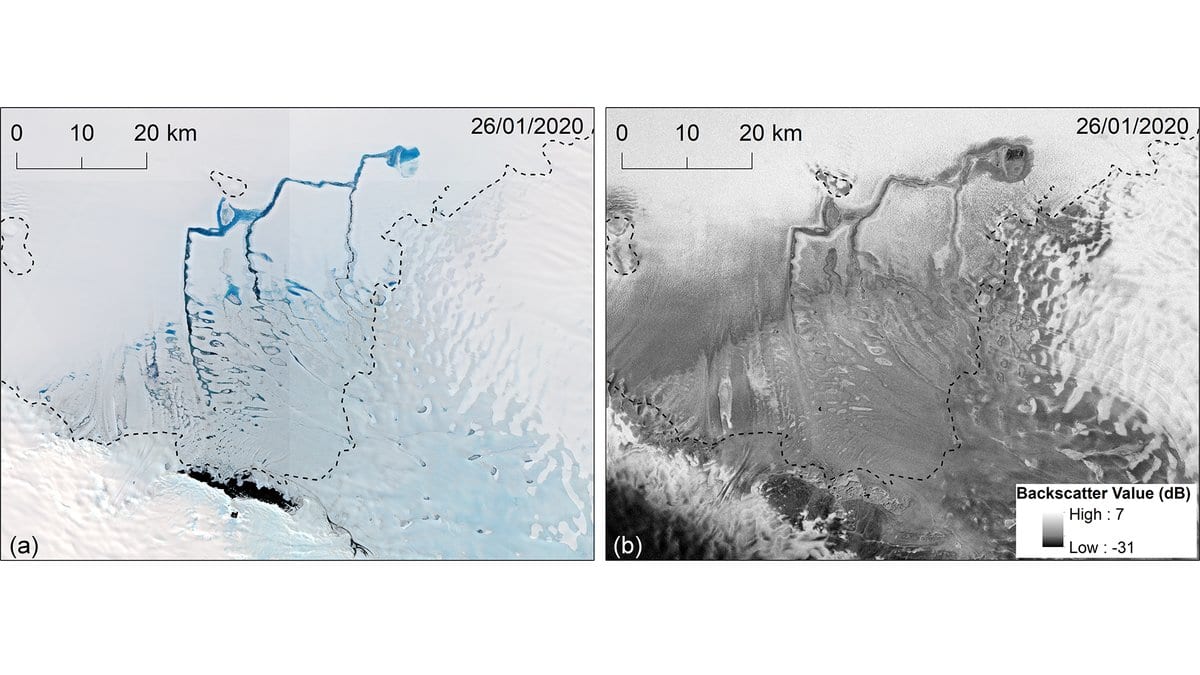
In January the sun does not set over Dronning Maud Land, and the flat white top of the Nivlisen Ice Shelf turns blue in lines. The lines are rivers. They begin as pools inland, cut down into the ice, join one another and run north toward the sea. By March they are gone.
Jiao Chen and colleagues in the geography department at Durham University have now followed those rivers through eight Antarctic summers. Their survey, published Oct. 12, 2026, in The Cryosphere, rests on one cloud-free January image per year from 2017 to 2024, and eight dates through one melt season. The team traced the channel lines by hand. Over the eight years the team mapped 710 separate drainage systems made of 5,513 channel segments. About half ended in a lake; the other half soaked into the firn, the packed old snow at the surface.
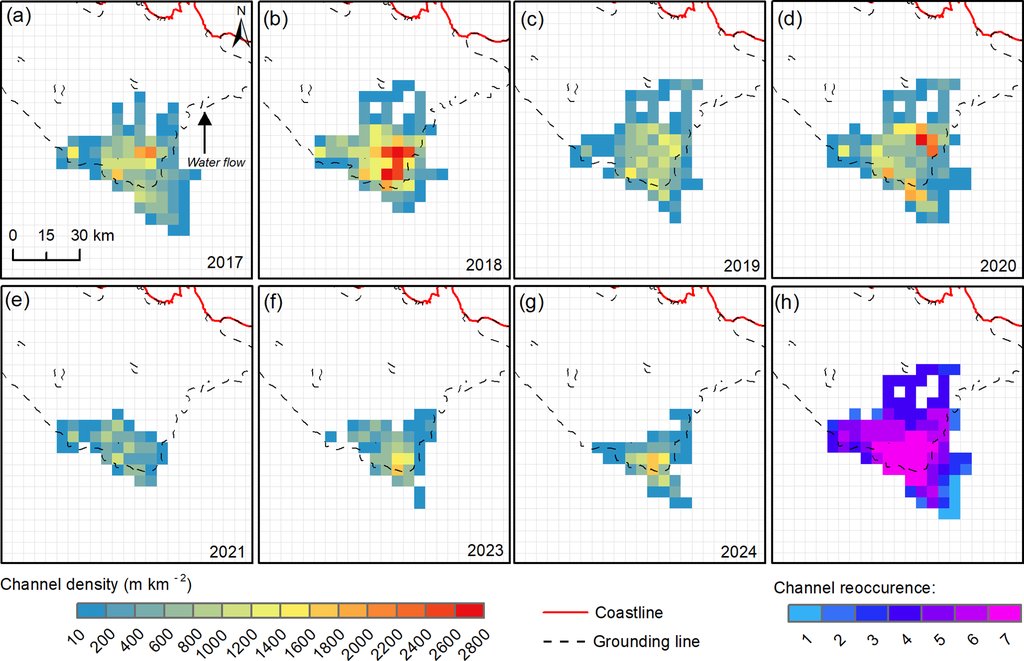
The summers are not alike. January 2018 was the largest in the record, with 1,650 channels and a combined length of more than 1,400 kilometers. The abstract of the same paper caps that total at 1,275 kilometers, a figure its own results give to 2020, while its conclusions put the same summer at about 1,440; where the paper disagrees with itself, the figures here are the ones in its results.
In January 2022 the shelf looked uniformly bright and not one channel was mapped, which is not the same as a measured shutdown: the climate model the team used shows exceptionally high summer snowfall before the satellite passed on Jan. 22, 2022, "contributing to the apparent absence of surface water in the optical record." The authors left that year out of their statistics for the same reason.
The big channels keep finding the same ground
Across the eight years the channels did not scatter at random. Their map of how often each patch of ice carried a channel shows the same ground used again and again near the southernmost part of the grounding line, where the shelf lifts off the bed, and especially beside the bare rock of the Schirmacher Oasis. The abstract's phrase for it is plain: "larger channels reforming in the same location."
What holds them there is the shape of the ice rather than the weather. The channels line up with flow stripes, the long ridges that the shelf's own movement leaves on its surface, and with crevasses. Gentler rumples push the water sideways. The clearest case is the main western channel, which swings almost 90 degrees to the east just after the three biggest channels merge. Chen and colleagues pulled a profile of the surface along it and found a low rise coinciding with the bend, raised over a point where the underside of the shelf touches the seabed. The same turn appears in consecutive summers.
The recurrence has limits, and the paper states them. The densest areas shifted over the eight years, new channels grew in 2020 where there had been none, and in 2022 there was nothing to map at all. What comes back are the larger pathways, not the network.
A second group watches the same shelf with radar. "This image is notable because the 'cerulean veins' we see on the surface align with a deeper, persistent plumbing system that we monitor with radar," Geetha Priya Murugesan, a remote sensing scientist at the Jyothy Institute of Technology in Bengaluru, India, told NASA's Earth Observatory, which published a Landsat 9 view of these channels in full flow on March 30, 2026. Her team's own account of the shelf's longer-term changes is still a preprint.
What one summer builds, and takes apart
In early December 2018 there were scattered pools. Through late December short, disconnected channels multiplied near the grounding line. By Jan. 25, 2019 the shelf carried 967 kilometers of channel, running from lakes at about 400 meters of elevation down to within roughly 20 kilometers of the ice front.
The telling number is the one that fell while the others rose. After Dec. 24, 2018 the count of separate drainage systems dropped from about 170 to about 100 even as the number of channels climbed. The pieces were not vanishing; they were joining up. February and March took the system apart again, though a few main channels were still sharp in early March.
The climate half of the work is its thinnest, as the authors themselves acknowledge. Mean summer temperature from the ERA5 reanalysis, a model reconstruction of past weather, tracks every measure of the drainage closely, reaching 0.99 for total channel length on a scale where 1 would be a perfect match. That rests on seven years, 2022 excluded, and the authors say plainly what it is worth: the relationships "should be interpreted as exploratory climatic context rather than definitive evidence of causal control." The thermometers at the nearby Novolazarevskaya research station do not reproduce the result, landing between 0.53 and 0.67 and too weak to count as significant. ERA5 covers the whole shelf on a grid; the station is one point beside it. Snowfall showed no significant link at all.
Where the water ends up
The water, in the end, mostly stays. Most of the meltwater the team mapped remained on the shelf, held in lakes or soaking into the firn, which the authors call "a closed surface hydrological system." The team found no pathway carrying water off the ice and into the sea. The channels, they suggest, "may buffer surface meltwater rather than directly promoting widespread meltwater export or vertical drainage."
Nor is this something warming has newly made. Checking older January pictures, the team found a large connected drainage pattern much like the biggest recent years in a Landsat image from January 2008, and a faint version of the same thing in a Landsat-2 image from 1976. That comparison is visual only. Such patterns, the authors write, "may occur episodically rather than representing a uniquely recent phenomenon."
What the map buys is a statement about place, not about risk. Nowhere does the paper put Nivlisen close to failing. It says that if warming raises how much meltwater an Antarctic ice shelf makes, or fills the old snow until it can hold no more, the pathways already cut into the surface will decide where that water gathers and refreezes, with possible local consequences for meltwater-driven cracking. The outlines of every channel and pool are deposited openly, so the next melt season can be tested against them. The same group had mapped the shelf's largest channels once before, in a single snapshot; the authors call this the first multi-year mapping of its drainage.