In One Corner of East Antarctica, the Ozone Hole Turns up in the Snowfall

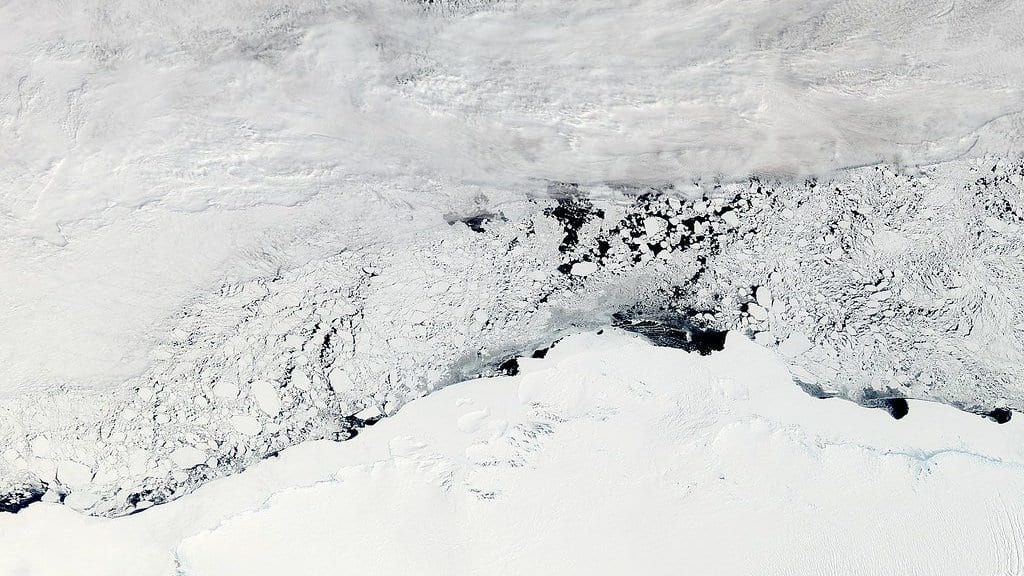
Enderby Land is one of the least-visited coasts on Earth, a long white shoulder of East Antarctica facing the Indian Ocean, with no permanent settlement and barely a weather station. What falls there falls as snow, and snow is how an ice sheet feeds itself. Whether more of it has been arriving in recent decades, and whether people are the reason, is one of the harder questions in polar science, because Antarctic weather swings so hard from year to year that a real trend can hide inside the noise.
A study published on Sept. 3 in The Cryosphere answers it for one small piece of that coast. Sai Prabala Swetha Chittella, of the Indian Institute of Technology Kharagpur and the British Antarctic Survey, worked with Andrew Orr at BAS and colleagues in India and Norway on 45 years of reanalysis — a physics-based reconstruction of past weather, assembled from satellite and other observations. In a single drainage basin within Enderby Land, they report, the rise in precipitation over that period can be robustly attributed to rising greenhouse gases and the thinning of stratospheric ozone. That holds for the annual totals and for the heaviest days alike.
That matters because Antarctic snow is not only weather. Precipitation is the main way the ice sheet gains mass, partly offsetting what it loses where glaciers meet the ocean, so a change in it is a change in the continent's contribution to sea-level rise. It is also a hole in the record: the IPCC's assessments of observed change in extreme precipitation largely leave Antarctica out.
Detecting a human signal is the easier half
The team used ERA5, the European reanalysis, from 1979 to 2023, averaged over the 18 drainage basins that ice-sheet scientists use to divide the continent. Six basins show rising annual totals (in the Filchner-Ronne sector, Dronning Maud Land and Enderby Land) and four show rising extremes (in Dronning Maud Land, Enderby Land and the Antarctic Peninsula). All of those trends clear significance at the 90 percent confidence level, a slightly looser bar than most fields use.
Then comes a distinction the paper keeps carefully and that is easy to blur. Detection asks whether a pattern can be explained by something outside the climate system's own churn: human or natural forcing of any kind. Attribution asks which forcing. Regressing the reanalysis against a large ensemble of CESM1 model runs, driven by every human and natural influence at once, the analysis found the signal in five of the six basins with rising totals and three of the four with rising extremes. Something external is driving them.
Naming that something worked in far fewer places. In the runs where one forcing at a time is held fixed, greenhouse gases and ozone depletion both emerged as robust drivers in a single basin — Ap-B, in Enderby Land — for the annual totals and for the heaviest days alike. In one more basin, K-A in Dronning Maud Land, ozone alone accounted for the rise in the totals, though not in the extremes. In every other case the confidence intervals ran through zero, meaning no individual driver could be named. Nothing anywhere could be attributed to industrial aerosols.
When the authors repeated the whole exercise with CESM2, a newer model in the same family, the signal was detected again and the attribution disappeared. No forcing, greenhouse gases included, could be robustly separated from the rest. The authors offer a possible reason: the CESM2 experiments are built differently and needed a three-way regression, with more freedom in it and more uncertainty. They present the disagreement rather than resolve it. The two model versions also contradict each other on aerosols, which raise Antarctic coastal precipitation in CESM1 and suppress it in CESM2.
The ozone result is the thinnest thread in the paper, and the authors say so. The stratospheric-ozone experiments run to only eight ensemble members and stop in 2005, which leaves their trends more exposed to chance. Their own two methods also disagree: a simpler first comparison of basin-averaged trends put the ozone signature in K-A and not in Ap-B, while the formal regression put it in Ap-B. Same trends, different statistics, reported by the authors rather than smoothed over.
The extra snow arrives in rivers of air
For a physical mechanism, the team turned to atmospheric rivers: narrow filaments of concentrated water vapor that run poleward off the Southern Ocean and dump their load when they hit the continent. Precipitation delivered by these rivers is rising over the basins in the analysis, by as much as 2 mm a year over Dronning Maud Land and Enderby Land, and over parts of those two regions the rivers account for essentially the entire increase the reanalysis shows. Earlier work by Jonathan Wille and others had already put their share of East Antarctica's heaviest precipitation at half or more. The moisture has somewhere to come from, too: these basins cluster in the Atlantic sector, where the surface ocean has warmed and the Weddell Sea has been losing ice.
Greenhouse gases should have made it drier
There is a wrinkle here, and the paper puts it in plain sight. More greenhouse gas is generally expected to push the Southern Annular Mode positive, tightening the westerly winds into a ring closer to the pole, which should leave East Antarctica colder and drier. The observed change runs the other way. One possibility the authors raise is that the relationship between those winds and East Antarctic temperature flipped early this century, alongside an anomalous zone of high pressure over the continent that would steer more northerly air, and more moisture, inland.
Two pieces of vocabulary are worth pinning down before this travels. ERA5's precipitation counts rain as well as snow; at these latitudes it is almost all snow. And although Antarctic researchers call these events extreme precipitation, and this paper adopts the term for consistency with the literature, the authors note in their introduction that what they are measuring is high-intensity precipitation rather than anything extreme: the wettest 5 percent of days on which precipitation fell at all.
External drivers have already left a mark on East Antarctic precipitation. Which drivers, and where, is still, in their words, a key limitation on understanding what the ice sheet does next.