Rivers of Air in the Far South Arrive Days Ahead of a Global Temperature Spike

Every day, Europe's climate service posts a single number on a public dashboard: the average surface air temperature of the whole planet, for the day before. It does not sit still. It drifts up for a few days, slides back, and now and then lurches to a record that makes the news.
Why that number swings from one year to the next is well-trodden ground, and El Niño does much of the work. Why it swings from one day to the next had never been examined, by the reckoning of the four researchers who have now examined it. Andrew D. King and Kimberley J. Reid of the University of Melbourne, Jonathan D. Wille of the Institut des Géosciences de l'Environnement in Grenoble and Eduardo Alastrué de Asenjo of the University of Hamburg report in Environmental Research Letters that in the southern winter, the answer lies over Antarctica.
Their paper was accepted Nov. 18, 2026, and posted the same day as an accepted manuscript, ahead of the typeset version. Taking the ERA5 reanalysis — a reconstruction of past weather — for 1979–2024, they picked the single warmest and single coolest day of each season, measured against what that calendar day usually looks like. That gave 46 spikes and 46 dips per season. Then they asked where on Earth the local weather on those days matched the global figure.
Almost nowhere. On the composite maps, most of the planet shows "a striking lack of a consistent signal": a hot day for the world is not a hot day in Berlin, Buenos Aires or Beijing. Two regions break the pattern. Over most of the Antarctic continent, unusually warm local temperatures line up with unusually warm global days, and cool with cool; central South America does the same over a smaller area and more weakly. The relationship appears in the southern winter and is absent in the southern summer.
The coldest continent is also the most changeable
The reason is not that Antarctica is cold but that it is erratic. Its winter temperature can change enormously from one day to the next, far more than anywhere else on Earth, and that gives the continent what the authors call "an outsized influence on the global average". When a large stretch of Antarctica warms sharply for a few days, the planetary mean follows it up.
What warms it arrives from the north. King and his colleagues found that spike days are typically preceded by a surge of water vapor moving poleward, strongest around 60–80 degrees south, in the window three to six days beforehand, and that dip days are typically preceded by a shortage of the same transport. The gap between the two sets of days is statistically significant. No single ocean is responsible, and the signal is clearest when every longitude is added together. The lead time shifts from event to event, which is why the window spans several days.
Much of that moisture travels in atmospheric rivers, the narrow filaments of concentrated water vapor that carry most of the water out of the subtropics. Coverage by those rivers around Antarctica and the Southern Ocean follows the same pattern: unusually high before global spikes, unusually low before dips. Repeating the whole analysis in a second reanalysis, Japan's JRA-3Q, gave very similar results.
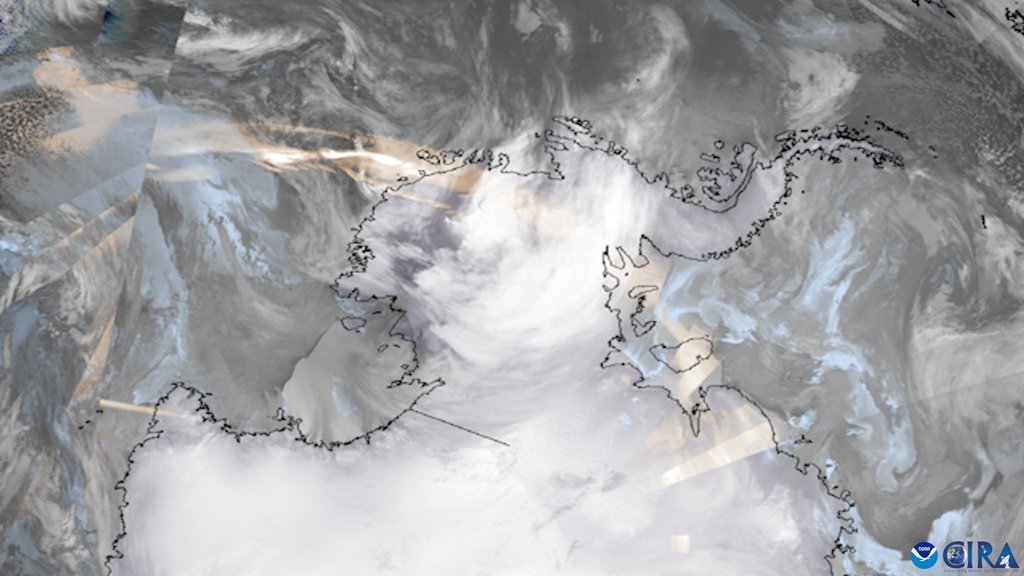
How the moisture warms the ice comes from earlier work and not from this analysis. Air moving poleward carries heat with it and releases more as its vapor condenses; the thick cloud that travels with it radiates heat down onto the surface, which matters most for the high interior; and where the flow meets terrain, it warms as it descends the far side. A 2024 study in Nature by Serena R. Scholz and Juan M. Lora found that atmospheric rivers warm much of the mid and high latitudes, and that the largest temperature departures of all are over ice.
What came before the hottest day on record
The clearest illustration is a single day. On July 22, 2024, the daily global average reached 17.15 °C. That was a record in the ERA5 series, the World Meteorological Organization announced. Europe's climate service judged at the time that the heat was probably related to very warm temperatures over large parts of Antarctica and the Southern Ocean. This paper fills that judgment in. Strong atmospheric rivers passed south of Australia and then crossed the South Atlantic in the five days before, and unusual warmth spread across the continent behind them. One case is an illustration, not a result; the statistics rest on the whole set of spike and dip days.
What the finding does not explain
Aggregated to whole seasons and years, the same link all but dissolves. Over 1980–2024, the typical size of a year's departure from the smoothed global trend is 0.107 °C. Take out the part El Niño accounts for and that figure falls to 0.06 °C. Take out the Antarctic moisture-transport part instead and it falls only to 0.103 °C. Their own summary: the effect on daily spikes and dips is sizable; the aggregated effect on seasons and years is not. The annual link to moisture transport is not statistically significant; the annual link to atmospheric-river coverage becomes significant once El Niño is removed, and in their words only just.
The paper calls itself a "purely observational analysis". The authors describe a causal link on daily timescales as "intuitive" and say the direction is less clear at seasonal and annual scales; the upward trends they find in poleward moisture transport may themselves be a consequence of warming. And the numbers come from the emptiest part of the observing network: Antarctica and the Southern Ocean have the fewest ground stations on Earth. The team restricted the analysis to the satellite era for that reason and still counsels caution. The claim to be first is scoped as well: day-to-day variability has been studied for years at local and regional scale, but to the authors' knowledge nobody had taken the question to the global mean.
The paper says plainly what the work is for: the global average temperature is the metric the Paris Agreement rests on, and its year-to-year behavior still produces surprises nobody has fully accounted for. If a weather-scale process in the far south leaves a mark on the daily series, and if climate models reproduce that mark, that is one more handle on the number everything else is measured against.
Sources
- Environmental Research LettersPeer-reviewed
- Nature
- wmo.int