Did the LZ Experiment Find Dark Matter and Why Is the Answer Far More Complicated Than a Simple “Yes” or “No”?

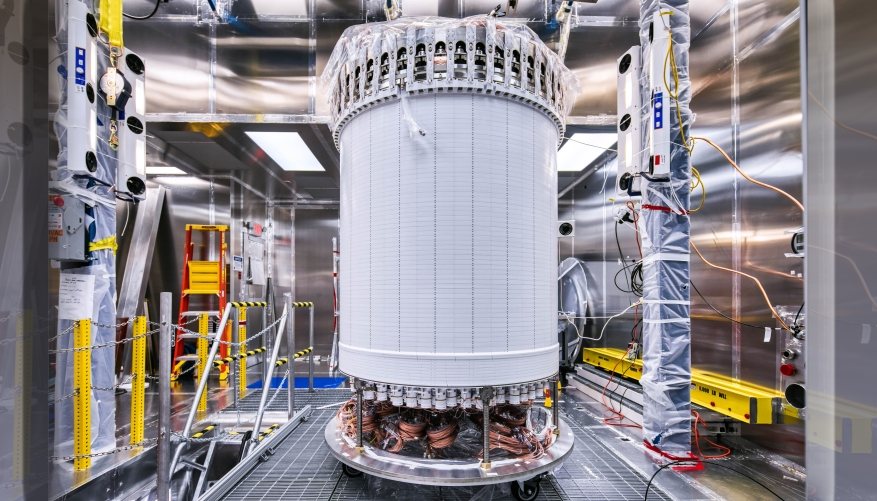
On September 1, 2026, the LUX-ZEPLIN (LZ) Collaboration reported an unusual event that its underground detector had recorded on June 16, 2023. The detector is designed to search for WIMPs: hypothetical weakly interacting massive particles that are candidates for dark matter. It is built to detect the extraordinarily rare event of a dark matter particle colliding with an atomic nucleus in ordinary matter, in this case, a xenon nucleus. A signal resembling precisely such an event was recorded.
The instrument detected two light signals: the first originated in the liquid xenon, while the second was produced in the layer of gas above it. Given the magnitude of the first signal, the second was weaker than a typical electron-recoil response, making the combination look more like energy being transferred to a nucleus. The LZ Collaboration (approximately 250 scientists and engineers from 39 institutions in six countries) analyzed all 220 live days of data, reconstructed the event’s position inside the chamber, estimated the recoil energy, and compared the recorded event with calibration data. Ultimately, the origin of the event remains unknown. However, one possible explanation is still a dark matter particle that may have collided with the nucleus of a xenon atom.
Richard Gaitskell, a professor at Brown University and the spokesperson for LUX-ZEPLIN, commented cautiously on the result: “We are not claiming to have seen dark matter. But we have seen something interesting that we want to share with the scientific community for their input.”
Can the event recorded on June 16 be regarded as evidence of dark matter? In physics, the strength of the evidence depends on the properties of the event and on how reliably researchers have accounted for processes that could mimic it. That is why I am interested here not so much in the signal itself as in the process of determining its origin. The researchers recorded two flashes of light, and now they must establish which physical process produced them.
To understand why physicists are considering a dark matter particle among the possible explanations, let us leave the xenon chamber behind and go back almost a century.
From Missing Mass to a Particle That Can Be Detected
The hypothesis that dark matter exists entered scientific discourse when the first observations of large-scale astronomical systems became available, and calculations showed that the matter visible within them (stars and gas) was insufficient to explain the measured gravitational effects. Observing the macroscopic universe (the motion of stars, gas, and galaxies under the influence of gravity) is the first approach to searching for dark matter. The other approach, known as direct detection (which is precisely what LUX-ZEPLIN does), moves in the opposite direction, into the microscopic world, and attempts to record a single interaction between a hypothetical dark matter particle and the nucleus of an atom of ordinary matter.
To understand why direct detection makes sense at all and exactly what calculations it is based on, it is worth returning to the origins of the dark matter hypothesis.
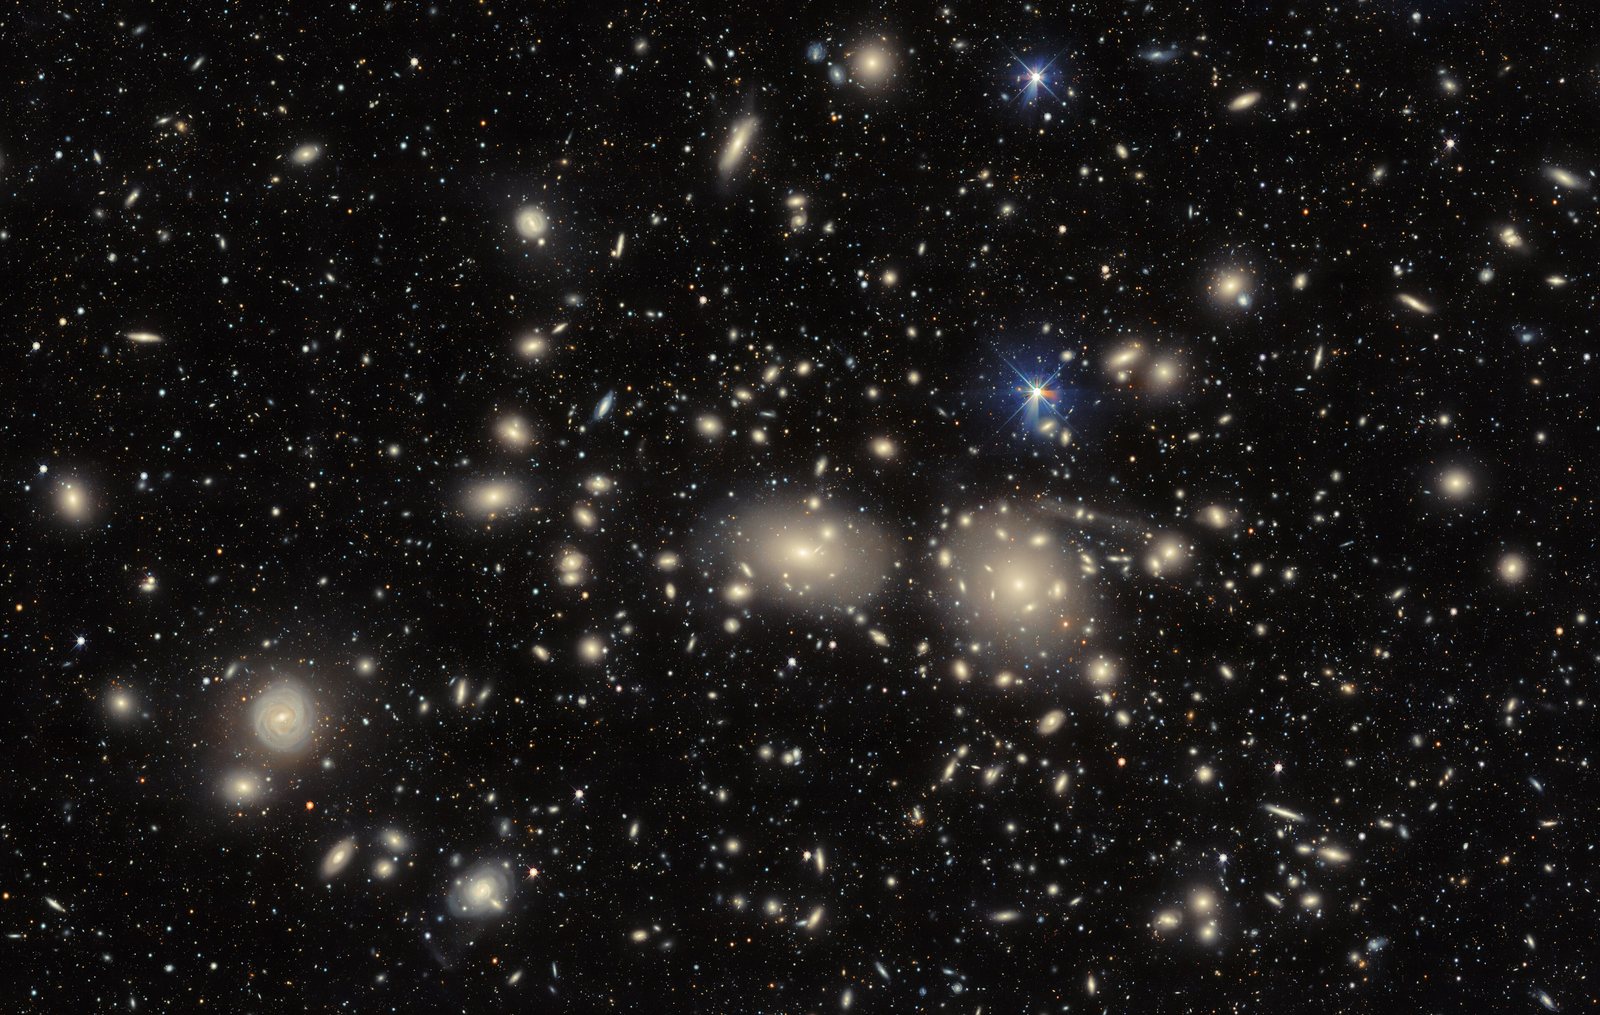
One of the earliest quantitative arguments in its favor appeared in 1933, when astrophysicist Fritz Zwicky studied the Coma Cluster. His paper reported the velocities of eight galaxies, although he considered the membership of one of them in the cluster uncertain. The characteristic dispersion of their velocities relative to the cluster’s mean motion was approximately 1,000 km/s. Zwicky applied the virial theorem, which relates the motion of objects to the gravitational energy of a system. If the cluster was, on average, in a stable state, velocities of this magnitude required more mass than its luminosity suggested.
He called the missing component dark matter (dunkle Materie) probably meaning nothing more at the time than ordinary matter that was too cold or too faint to be detected using the observational methods then available. His calculation indicated how much gravitating matter was present, but revealed almost nothing about what it was made of. This gap between “how much” and “made of what” would later become central to direct-detection searches.
The problem could be studied in much greater detail at the scale of individual galaxies because astronomers were able to compare the distribution of luminous matter with the motion of gas at different distances from a galaxy’s center. In a 1970 study, astronomers Vera Rubin and Kent Ford measured the velocities of 67 regions of ionized hydrogen in the Andromeda Galaxy at distances ranging from 3 to 24 kiloparsecs from its center, making it possible to trace how the gas’s motion changed with distance. New image intensifiers reduced the required exposure times to 60–90 minutes.
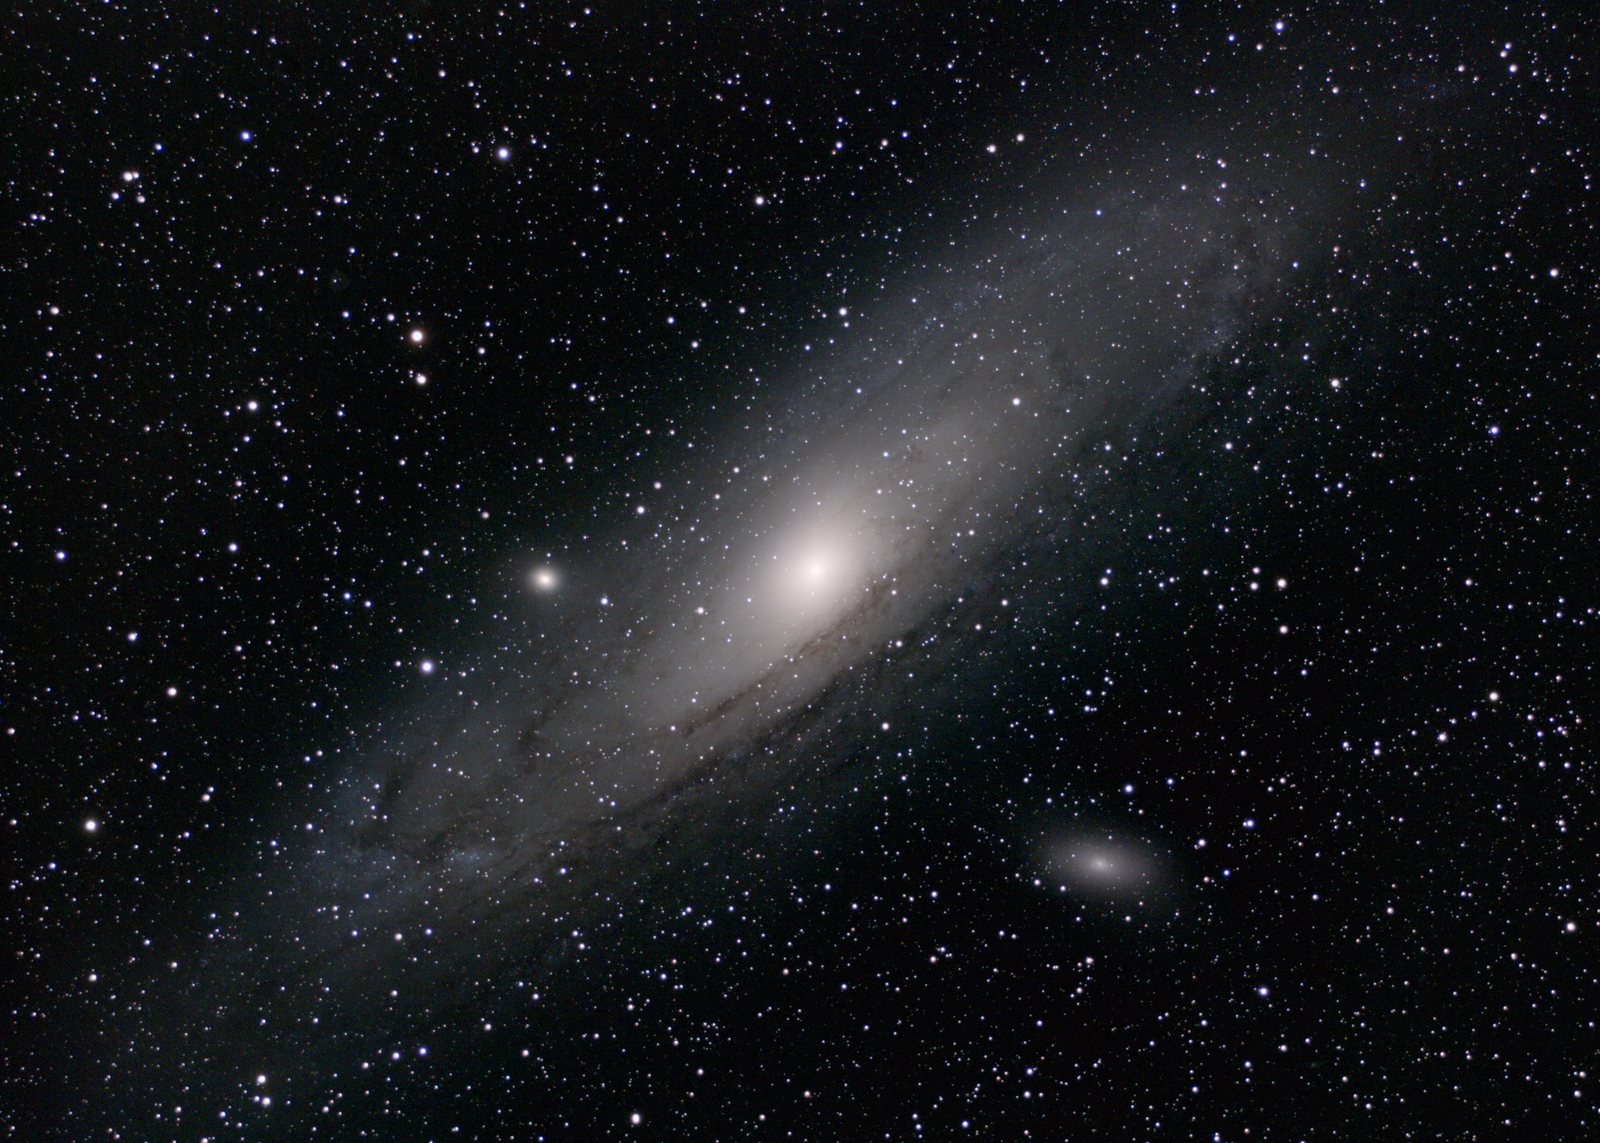
Using the gas spectra, Rubin and Ford measured how fast the gas was moving along the line of sight. Then, assuming that it orbited the center of Andromeda along nearly circular paths, they reconstructed its rotational velocity. From this, they calculated how much mass had to lie within different distances from the galactic center for its gravitational attraction to sustain such motion. They found that the required mass continued to increase out to the most distant regions for which they still had reliable measurements. At the same time, the gas’s rotational velocity at large distances from the center did not decrease as sharply as would be expected if most of the mass were concentrated in the same region as the luminous matter. In the modern understanding, this is one of the important arguments for dark matter: far from the center, little visible matter remains, yet the gas does not slow down, suggesting that its motion may be governed by invisible mass.

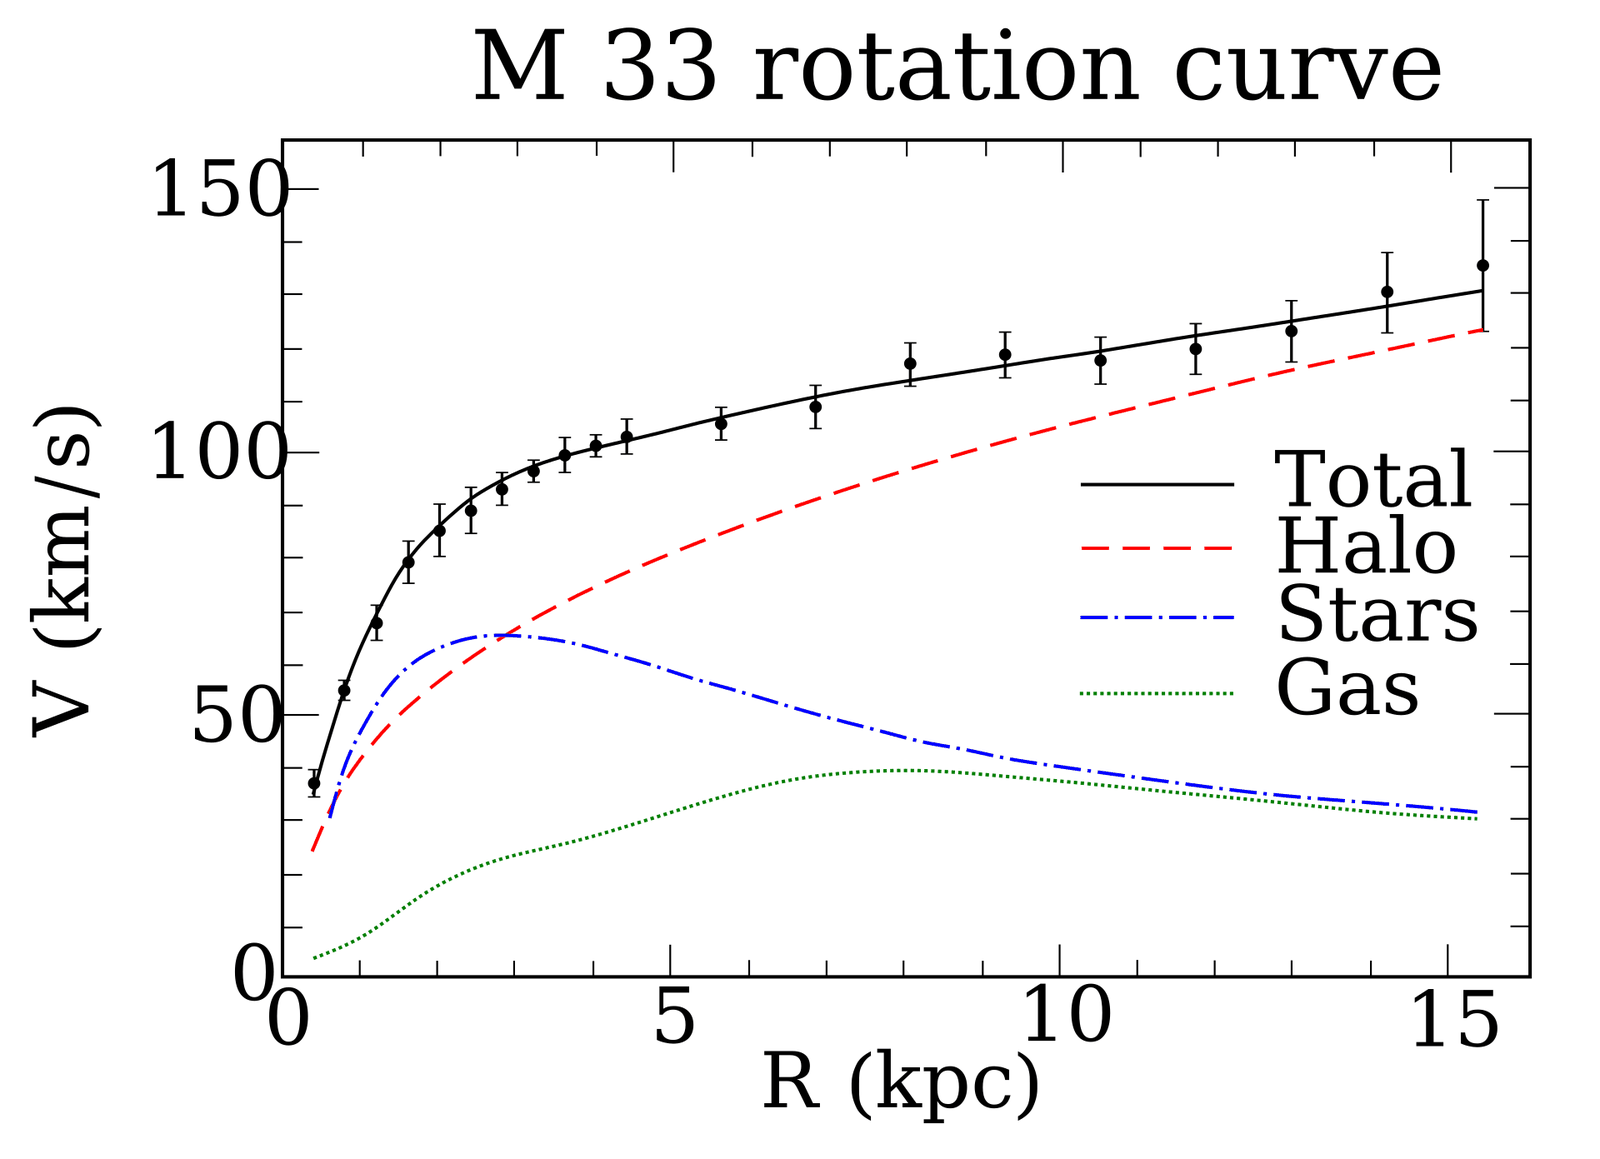
The same problem is clearly seen in the Triangulum Galaxy, M33. Astronomers calculated how fast the gas should rotate if the gravitational attraction of only the observed stars and gas were taken into account. In the galaxy’s outer regions, the measured velocity was substantially higher than the calculated value. In their study, Edvige Corbelli and Paolo Salucci showed that the calculated rotation curve could be brought into agreement with the observations by adding an extended dark matter halo that exerts additional gravitational attraction.
Let us move from individual galaxies to the scale of the entire Universe. Here, the principal source of information about dark matter is the cosmic microwave background, the relic radiation preserved from the early stages of cosmic expansion. It allows scientists to estimate the proportion of dark matter in the overall composition of the Universe.
When neutral atoms formed in the early Universe, the number of free electrons decreased dramatically, and light ceased to scatter from them continuously. Small variations in the temperature of this radiation across the sky preserved information about the original inhomogeneities. These inhomogeneities, “ripples” in density, grew under the influence of gravity. Ordinary matter alone would not have had enough time to assemble into the structures we observe, whereas dark matter, which does not interact with light, began to clump earlier, providing the framework for future galaxies. Dark matter also influences the gravitational potentials in which acoustic oscillations occurred in the early plasma, thereby affecting the structure of the acoustic peaks in the cosmic microwave background spectrum. The positions and heights of these peaks make it possible to determine how much of the Universe consists of ordinary matter and how much consists of dark matter.
In the Planck 2018 results, researchers working within the standard ΛCDM cosmological model found that ordinary matter accounts for about 5% and cold dark matter for about 26.5% of the Universe’s present-day total energy density. Dark matter is called “cold” when its particles were moving much more slowly than light long before galaxies began to form. Dark energy, which is associated with the accelerating expansion of the Universe, makes up most of the remaining energy density. In the model’s name, Λ denotes the cosmological constant used to describe dark energy, while CDM stands for cold dark matter. Dark matter constitutes approximately 84% of all matter; in this calculation, dark energy is excluded from the denominator. It is important to clarify that these figures were obtained specifically within the framework of the ΛCDM model. In other words, they do not represent a direct “weighing” of the Universe’s contents, but rather our best current estimate of its composition, derived from observations interpreted within this model.
This raises an important question: could the missing mass be explained by ordinary matter that is simply too faint or too cold for us to see? An independent estimate of the baryon (ordinary matter) abundance, based on primordial deuterium, a heavy isotope of hydrogen, helps answer this question. The amount of deuterium formed in the early Universe depends on the density of protons and neutrons at that time. By comparing the observed abundance of deuterium with calculations of nuclear reactions, researchers can determine the total amount of baryonic matter, including matter that does not emit light. This estimate shows that there is too little ordinary matter in the Universe to account for the missing mass: it cannot all be attributed to faint stars, planets, or cold gas.
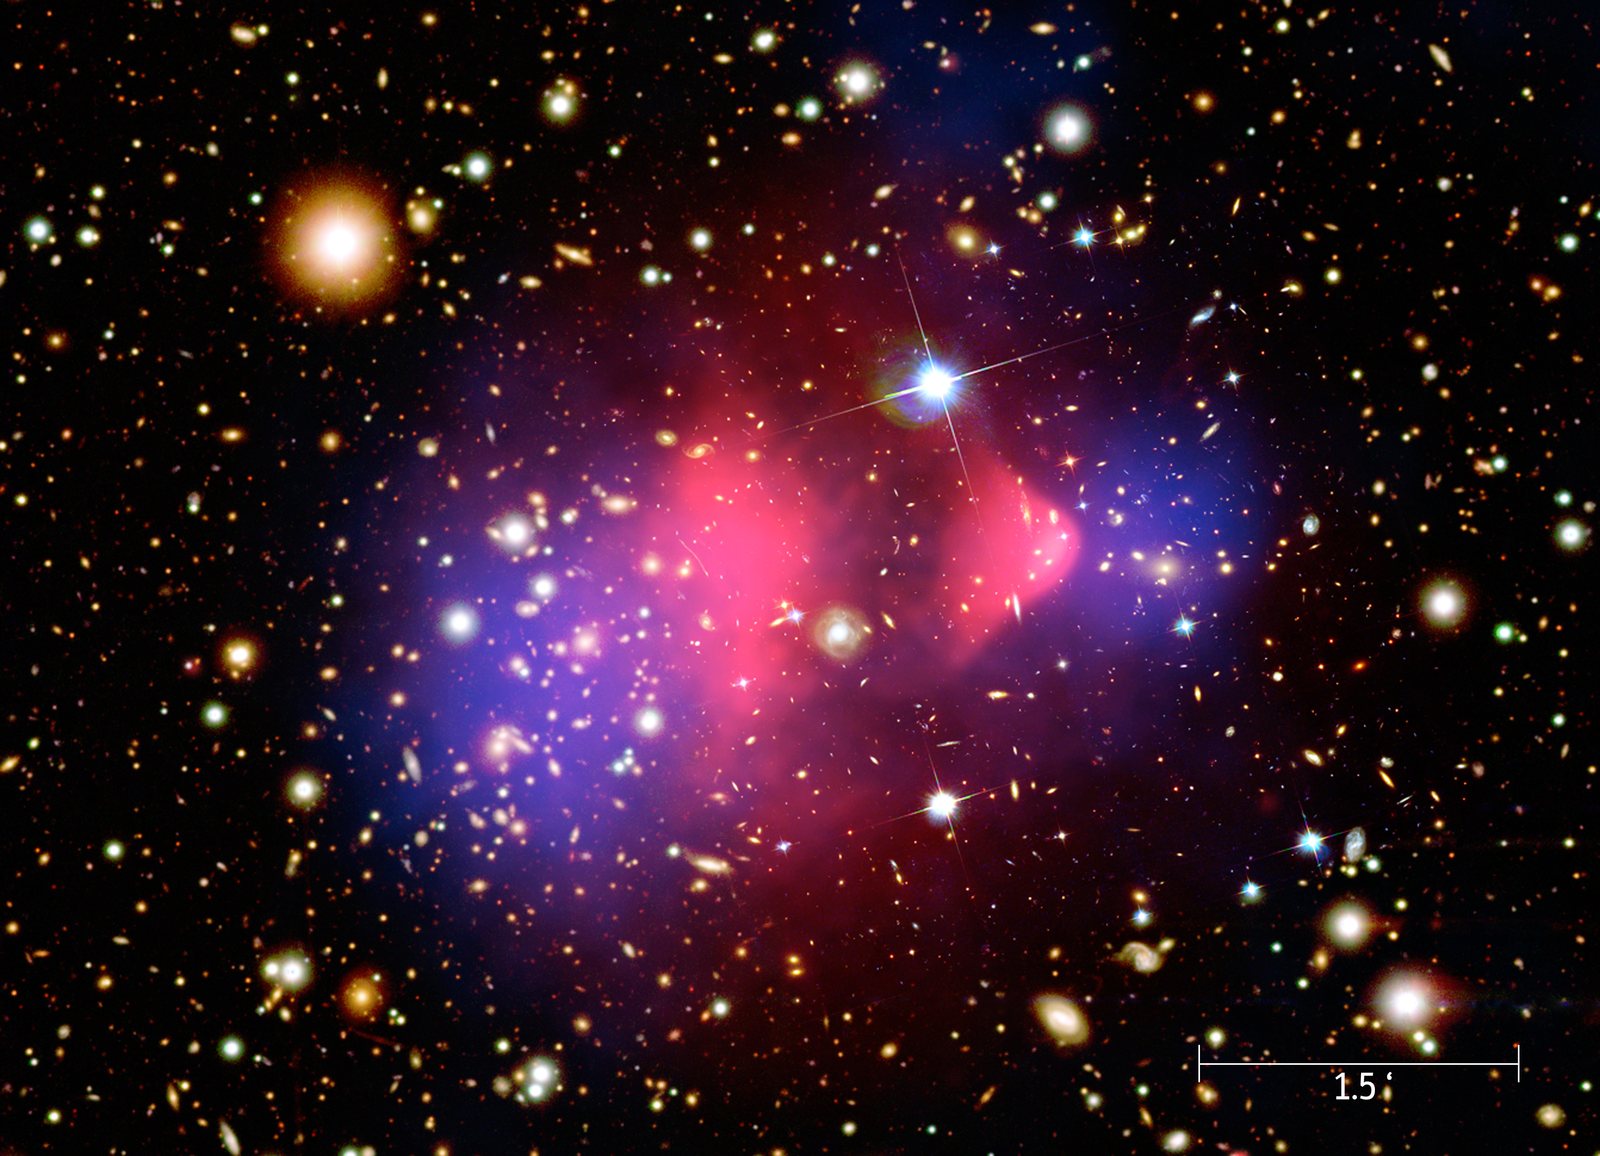
The Bullet Cluster provides another argument for the presence of unaccounted-for mass. In 2006, astrophysicist and observational cosmologist Douglas Clowe and his coauthors compared the distribution of gas in the cluster with the distribution of its total mass, reconstructed through gravitational lensing, which distorts images of distant background galaxies. When the two clusters collided, the hot gas, which contains most of their ordinary matter, slowed down, while the galaxies continued moving forward. The centers of mass concentration remained close to the galaxies that had moved ahead, separate from the gas clouds.
However, the unusual motion of stars and gas does not necessarily have to be explained by the presence of invisible mass. An alternative approach is to assume that the familiar laws of motion operate somewhat differently at extremely low accelerations.
At the scale of galaxies, there is an important relationship that both approaches must explain. Astronomers Stacy McGaugh, Federico Lelli, and James Schombert compared 2,693 measurements from 153 galaxies and found a tight relationship between the observed acceleration and the acceleration that can be calculated solely from the distribution of ordinary baryonic matter. This imposes an important requirement on dark matter models: they must explain why the influence of an invisible halo is so precisely linked to the distribution of visible matter.
One alternative to dark matter as an explanation for why stars and gas in galaxies move faster than Newtonian calculations based on visible matter would predict is Modified Newtonian Dynamics (MOND), which proposes that the law of motion changes at extremely low accelerations. MOND can also be tested using much simpler systems such as wide binary stars. This is particularly convenient because it eliminates the need to model an entire galaxy. In 2026, researcher Stephen Cookson and his colleagues studied such pairs and did not find the approximately 20% increase in their relative velocities predicted by the version of MOND being tested, compared with Newtonian calculations. In this study, the observations were consistent with the Newtonian description, thereby narrowing the range of possibilities for that version of MOND.
By the time LUX-ZEPLIN was developed, astronomy had already established a reasonably clear picture of how much dark matter may exist, where its gravitational influence appears, and how it is distributed. Yet we still know almost nothing about its microscopic nature. If dark matter consists of particles that interact with atomic nuclei even occasionally, the next step must be taken in the laboratory, using an instrument capable of detecting a single collision of this kind. Nearly a century of astronomical observations has defined the requirements that dark matter must satisfy. LUX-ZEPLIN is now attempting to determine whether a rare signal could become the first direct evidence of an interaction between a dark matter particle and ordinary matter.
Seven Metric Tons of Xenon Beneath One and a Half Kilometers of Rock in the Search for Dark Matter
Let us bring the search for dark matter back from deep space down to Earth, or, more precisely, beneath it. The LUX-ZEPLIN detector is located approximately one and a half kilometers below the surface at the Sanford Underground Research Facility in South Dakota. This is the former Homestake Gold Mine, the same place where Ray Davis spent decades detecting solar neutrinos, work for which he received the 2002 Nobel Prize. Underground physics has a fondness for well-established sites.
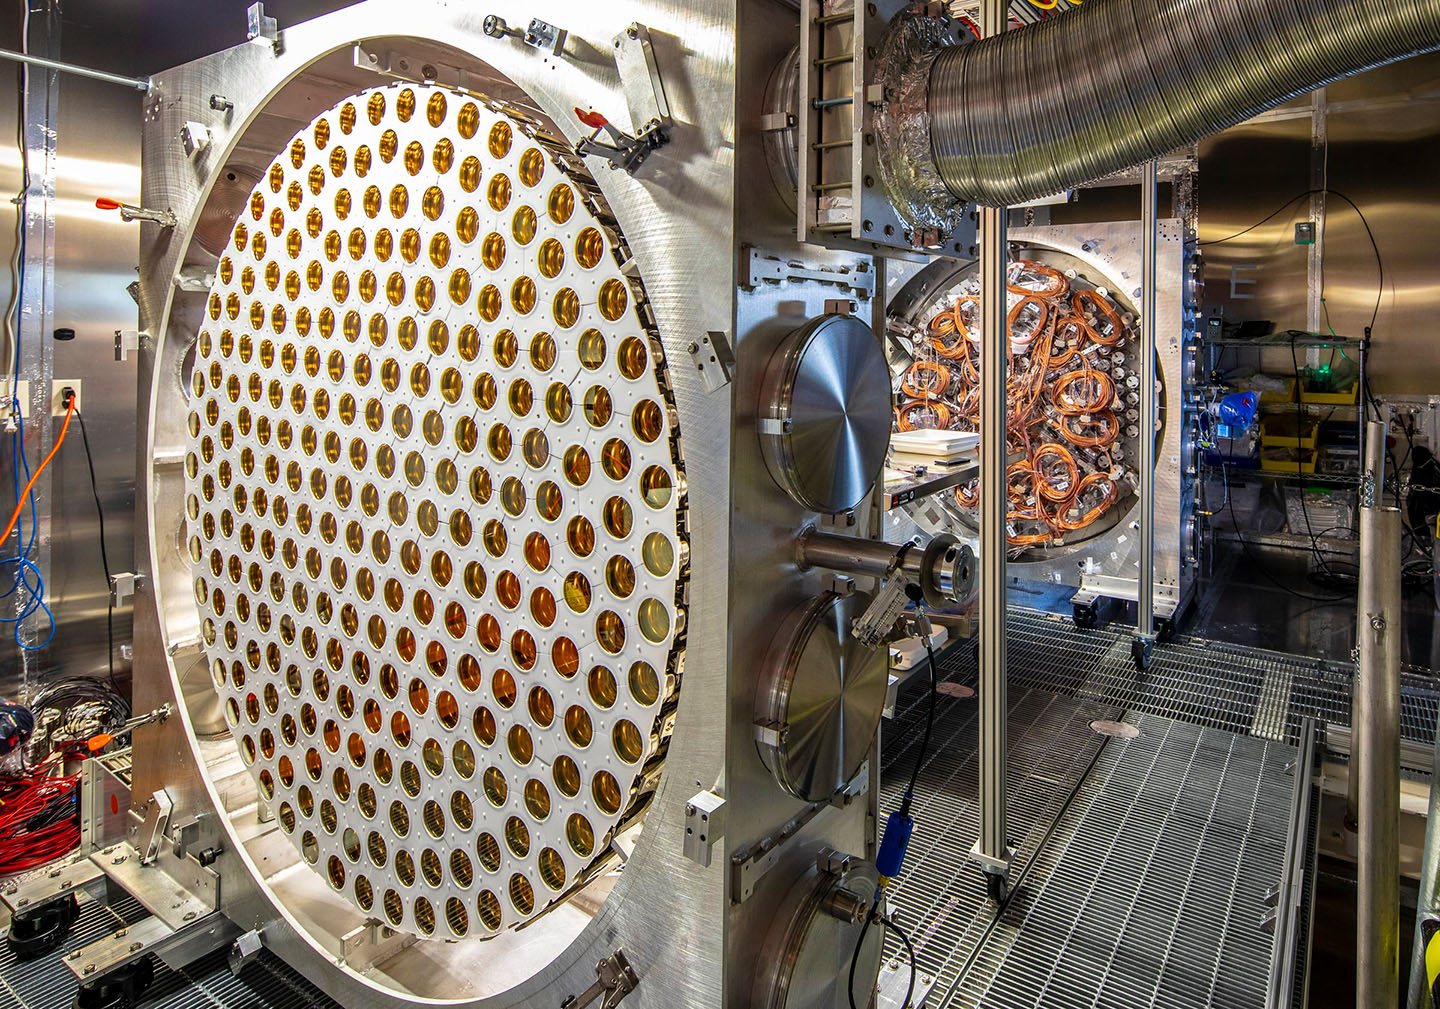
Laboratories of this kind are built underground because the thick layer of rock suppresses the flux of cosmic particles, while additional detection systems help identify events that could enter the main detector from outside. The instrument contains approximately seven tonnes of liquid xenon. For the analysis published in September 2026, the Collaboration used a central fiducial region containing 4.71 ± 0.08 tonnes, kept away from the detector walls and their materials, which have higher levels of radioactive background.

How LZ Distinguishes Electron Recoils from Nuclear Recoils
So what exactly happened inside the detector on June 16? Some particle transferred energy to the xenon, producing a characteristic response: two flashes of light. The physicists’ task was then to use these two signals to determine what the particle had interacted with.
When a particle transfers energy to liquid xenon, some of the atoms become excited, and some electrons are liberated. The excited xenon produces the first flash of light, S1. Meanwhile, an electric field carries the free electrons upward, and once they reach the gaseous layer, they produce a second flash, S2. The delay between these signals reveals the depth of the interaction because the electrons require a finite amount of time to travel through the liquid. In essence, the detector works like sonar, except that the “echo” is a cloud of electrons drifting toward the surface. The distribution of S2 light across the upper photodetectors enables reconstruction of the other two coordinates. A single brief interaction therefore leaves a remarkably detailed record of both its location and the material’s response.
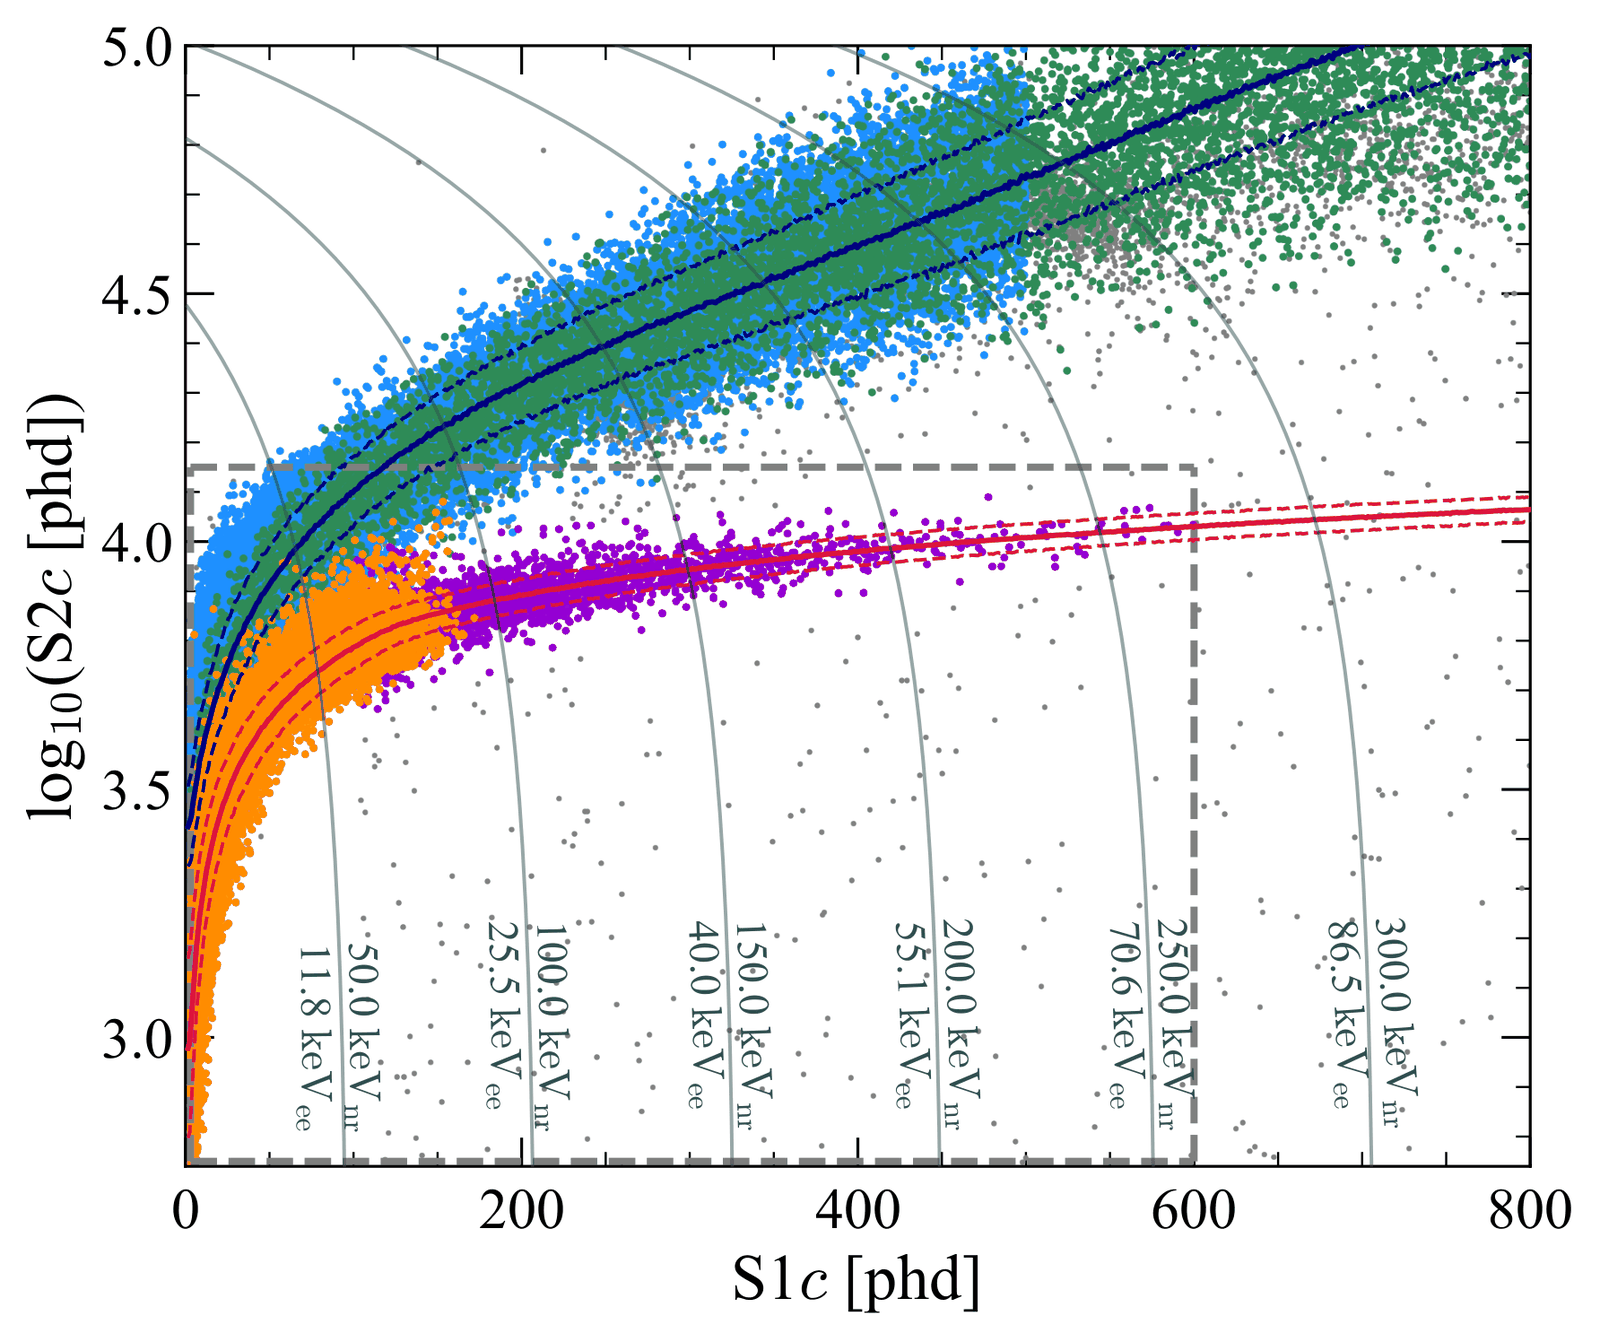
A collision with an electron produces an electron recoil, while energy transferred to a xenon nucleus produces a nuclear recoil. For the same S1 magnitude, nuclear recoils generally produce a smaller S2, and calibration measurements make it possible to characterize the distributions of both types of events in advance. Because of statistical fluctuations in the detector response, the electron-recoil and nuclear-recoil distributions partially overlap. As a result, some electron recoils may fall by chance within the region more characteristic of nuclear recoils. A neutron can also transfer energy to a xenon nucleus in almost the same way as certain dark matter particles are expected to do. Consequently, the mere presence of an event in the nuclear-recoil region does not establish its origin. The detector shows what type of interaction the signal resembles, but determining which particle actually caused it requires consideration of all the other experimental data.
What Made the June 16 Event Stand Out
For its new analysis, LZ extended the upper boundary of the nuclear recoil energy range under study from approximately 55 to 270 keV. This change alone is crucial because previous searches focused on lower energies, thereby excluding potential high-energy events from the main analysis. The study included 220 live days of data collected between March 27, 2023, and April 1, 2024, corresponding to an exposure of 2.84 tonne-years for the selected xenon mass. After all selection criteria were applied, 1,710 events remained. When fitted to the data, the background-plus-signal model predicted 1,713 ± 39 events. Thus, there was no appreciable excess in the total event count. But what matters is not only the number of events; it is also where they fall in terms of S1 and S2. An individual event may appear in a region where known background processes enter only extremely rarely.
That was precisely what made the June 16 event unusual. If interpreted as a nuclear recoil produced by elastic scattering, it has an energy of 248 keV, with a statistical uncertainty of ±23 keV and a systematic uncertainty of ±23 keV. The former is associated with random variation in the recorded response, while the latter reflects the accuracy of the xenon-response model.
This energy alone is insufficient to reconstruct the mass of the incident particle because the amount of energy transferred also depends on its velocity and the scattering angle. The relationship between the two flashes provides even more information about the type of event. After correcting for the spatial dependence of the detector response, the S2 magnitude was 6.7σ below the center of the electron-recoil distribution at that S1 and 1.5σ below the center of the nuclear-recoil distribution. Here, σ is the standard deviation of the corresponding distribution: the larger the number of standard deviations, the farther the event lies from the typical value. In other words, this relationship between S1 and S2 is extremely unusual for an electron recoil but considerably closer to what is expected for a nuclear recoil.
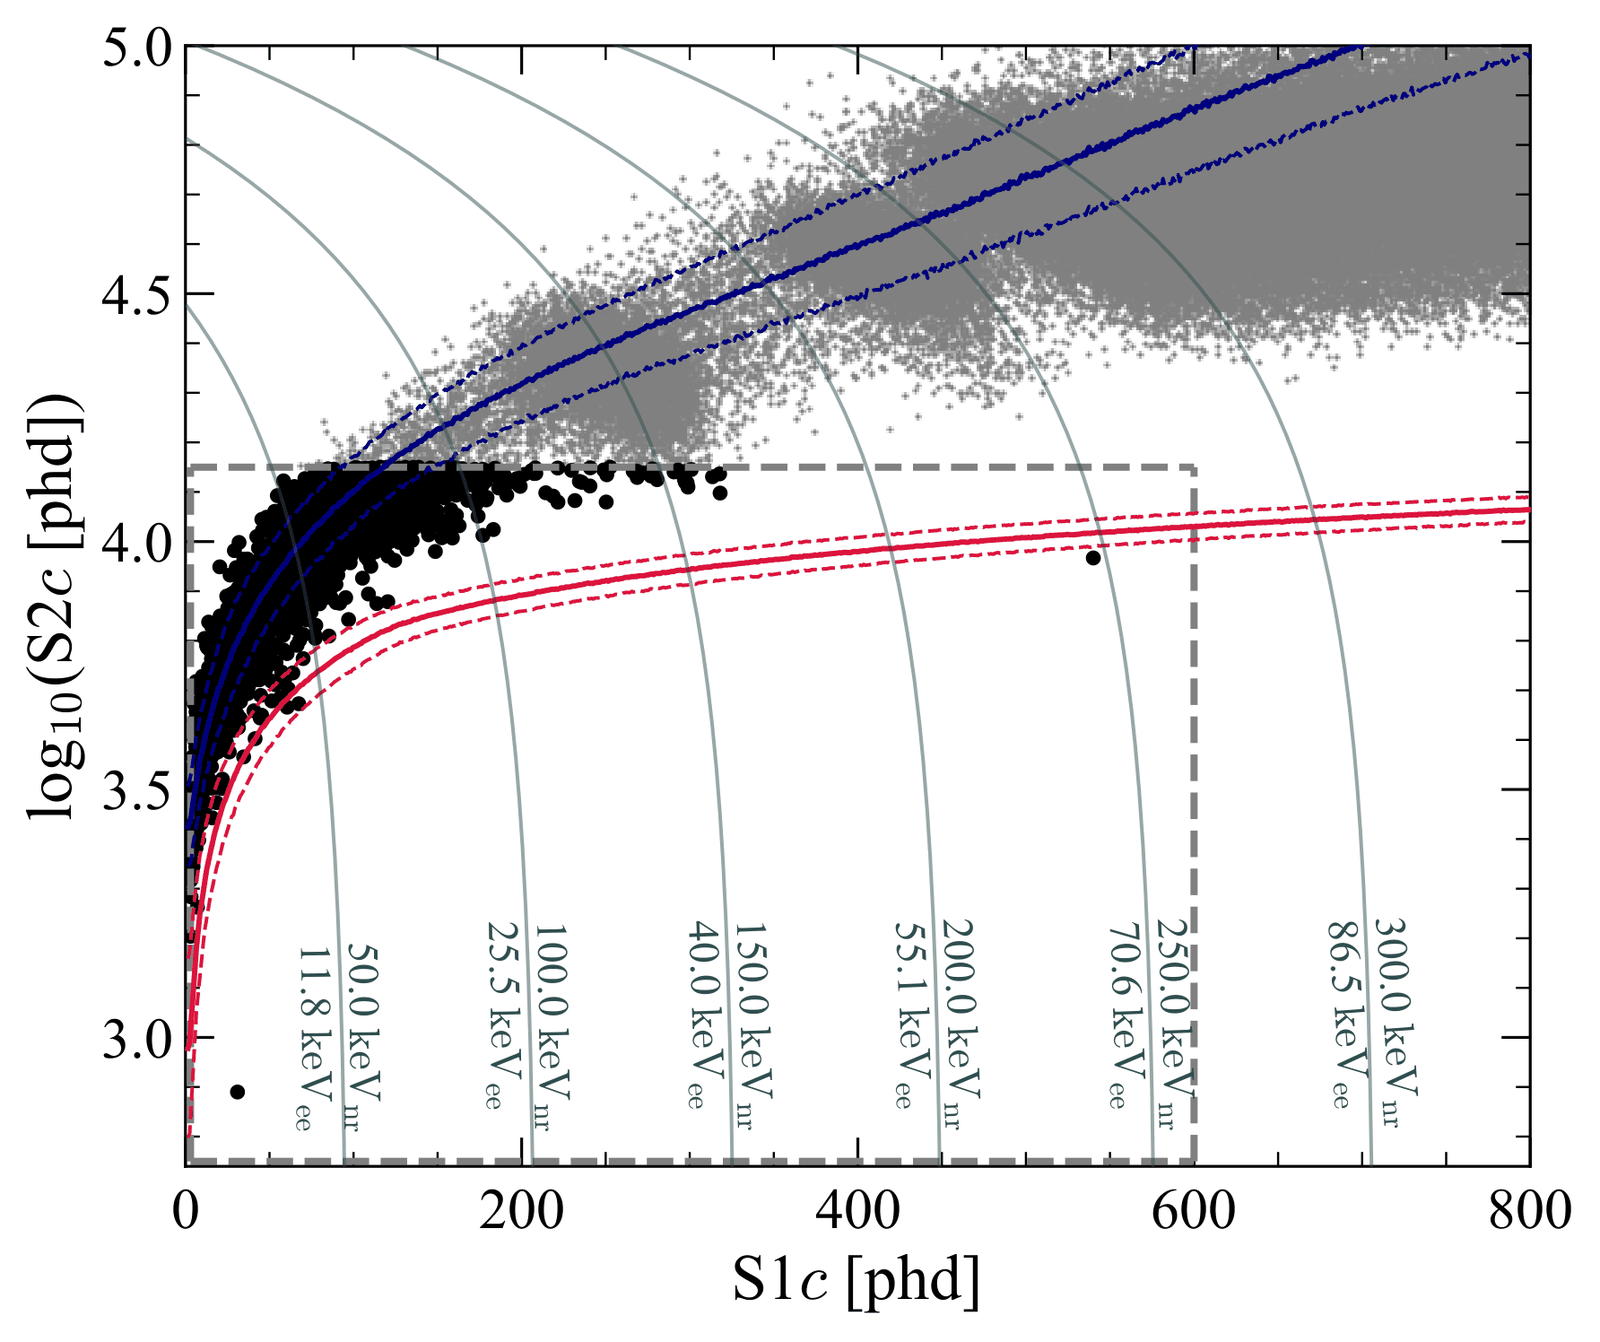
Within the narrow S1 range containing the June event, the model of known background processes predicts 0.0106 ± 0.0008 events. Roughly speaking, across one hundred such datasets, the background would produce an average of about one event in this region.
Yet the rarity of the event alone does not answer the central question: how strongly does the overall result conflict with the hypothesis that only background is present? To answer this, physicists use statistical significance, which is also conventionally expressed in units of sigma (σ). Here, the number of standard deviations indicates how rarely the background alone could produce an equal or greater deviation. The Collaboration considered 616 models involving interactions between xenon nuclei and particles of different masses, calculating a separate distribution of expected events for each. The largest departure from the background-only hypothesis had a local significance of 3.4σ.
However, after accounting for the look-elsewhere effect across all the models tested, the significance of the result decreased. LZ grouped models with nearly identical distributions, leaving 293 distinguishable cases. The researchers then repeatedly simulated background-only experiments and reran the entire search on every synthetic dataset. In approximately five cases out of a thousand, the background produced a deviation at least as large as the one observed in the real data. After this correction, the global significance fell to 2.6σ, corresponding to a p-value of approximately 0.5%. By the standards of particle physics, that is an “intriguing” result: 3σ is conventionally described as “evidence” and 5σ as a “discovery.” The p-value is the probability of seeing a deviation at least this large purely by chance, assuming that only known background processes are at work. It is not the probability that the event was caused by dark matter.
The question remains: what could have suppressed the second signal? One possible mechanism involves charge loss. A gamma ray can undergo multiple scatters in nearby regions of the xenon, and the nearly simultaneous light from these interactions merges into a single S1 pulse. Some of the ionization electrons, however, may be produced near the detector wall or in a charge-insensitive region, such as below the cathode, from which they cannot be drifted to the gas phase. The resulting S2 signal is then smaller than expected, shifting what is actually an electron recoil into the nuclear recoil band.
To estimate the probability of such a misclassification, researchers need to know the dimensions of the charge-loss regions and the frequency of interactions occurring at multiple sites. A rare process may be almost invisible among the other events yet still appreciably affect the expected background near a single candidate.
The Collaboration also examined the event’s temporal surroundings. A cobalt-57 calibration source located on the opposite side of the detector had been removed from the instrument 25 minutes before the event was recorded. The most recent preceding muon had been detected by the Outer Detector 41 minutes earlier and by the xenon time projection chamber 127 minutes before the event. Because muons can produce neutrons, any possible temporal connection had to be considered separately.
To transfer approximately 250 keV to a xenon nucleus, a neutron must have an energy of at least about 8 MeV. If a flux of such neutrons sufficient to explain the June event is assumed, the model predicts additional lower-energy recoils. No corresponding population of events is present in the LZ data.
Of particular interest is how the researchers protected the analysis itself from being adjusted in response to the unusual event. LZ used a procedure known as salting, in which artificial signal-like events are added to the real data in advance, while the analysts developing the procedure do not know which events were deliberately inserted. The practice grew out of bitter experience: when an analyst sees a candidate before finalizing the selection criteria, there is a temptation (even an unconscious one) to tweak those criteria. Adding “salt” to the data makes such adjustments pointless.
I should note that the authors themselves describe the most vulnerable aspect of this procedure. For the new high-energy range, the artificial events were generated using the previous xenon-response model and did not adequately populate the high-energy nuclear-recoil region. The Collaboration therefore explicitly describes the analysis as non-blind. The researchers carried over most of the selection criteria from their previous study and finalized the analysis selections and probabilistic models before removing the remaining artificial events.
Thus, the data associated with the June 2023 event have now been examined quite thoroughly. The Collaboration evaluated the event’s energy when interpreted as a nuclear recoil, its position relative to the calibration distributions, its statistical rarity, and several physical mechanisms that could distort the relationship between S1 and S2. No convincing explanation in terms of known background processes has yet been found, but the authors themselves identify possible sources of uncertainty. The question therefore shifts from the detector to the hypothetical particle: if the signal is indeed associated with dark matter, the model must explain an event near 248 keV while simultaneously predicting no excess in the regions where the LZ detector does not observe it.
From Background to Particle: Testing at Lower Energies
Once the background processes have been examined, the investigation inevitably shifts from the detector’s operation to the properties of the hypothetical particle, in this case, a WIMP. The same 220 live days of observation were included in LZ’s previous low-energy search. Combined with earlier data, that study covered 280 live days, corresponding to an exposure of 4.2 tonne-years.
In the simplest scenario, a hypothetical WIMP dark matter particle collides with a xenon nucleus much like one ball striking another: the particles do not transform into anything new but merely exchange some of their kinetic energy. This type of collision is known as elastic scattering. In many WIMP models, events with low recoil energies should occur more frequently than events with high recoil energies. A model that explains a rare event at 248 keV should therefore generally predict a larger number of weaker events at lower energies. Yet it was precisely in this region that the previous LZ analysis found no statistically significant excess. A viable model must therefore explain the 248 keV event without predicting too many events where the detector has not observed them.
One way to avoid this problem is through inelastic scattering. In such a collision, the dark matter particle transitions to a heavier state, so the interaction requires more energy. As a result, for certain parameter values, low-energy events hardly ever occur. An event near 248 keV could then be compatible with the absence of any excess at lower energies in the LZ data. This is why the first theoretical attempts to explain the event recorded by LZ quickly focused on inelastic scattering models.
Could It Have Been a Higgsino?
On September 1, Katherine Freese and Dionysios Theodosopoulos proposed an alternative explanation: the event may have been a collision with a higgsino, a hypothetical particle and the supersymmetric partner of the Higgs fields. Their preprint appeared on the same day as the LZ announcement. Theorists can respond within hours in cases like this: offering the first interpretation of a major event is itself a race. In their model, the particle has a mass of approximately 1 TeV/c², or about one thousand proton masses, while the mass difference between its two neutral states is on the order of 350 keV/c². The interaction proceeds through a Z boson, so once the model parameters are selected, the cross section is fixed and the collision rate cannot be adjusted to fit a single event. This unique event has a property that simultaneously complicates its interpretation and makes the explanation testable: its energy is determined by the same model parameters that govern the expected number of events in the other regions of the spectrum.
Two days later, researchers Nicholas Rodd, Benjamin Safdi, Tracy Slatyer, and Weishuang Linda Xu examined a closely related scenario involving a higgsino with a mass of approximately 1.1 TeV/c². Their calculation connects the present-day abundance of these particles with the thermal history of the early Universe, when higgsinos were produced and annihilated in the hot plasma, with these processes becoming increasingly rare as the Universe expanded and cooled. For the selected parameters, the relic density could match the present-day dark matter density. The difficulty arose in the high-energy portion of the spectrum: the same model predicts events at higher energies, yet LZ does not observe them.
In a preprint published on September 3, theoretical physicist Christopher McCabe approached the same class of models from a different direction and calculated the seasonal variation in the rate of inelastic scattering. Earth orbits the Sun, so its velocity relative to the Galactic halo changes throughout the year. When the kinematic threshold is high, even a small increase in the relative velocity noticeably changes the number of particles with sufficient energy to scatter. In some versions of the calculation, no such events should occur at all during part of the year. The LZ event occurred on June 16, and its coincidence with a period of high expected event rates naturally attracts attention. Testing this seasonal dependence, however, will require additional events whose dates and energies agree with the calculated distribution.
What Comes Next?
LZ is continuing to collect data and plans to accumulate 1,000 live days, so testing the June event is already built into the experiment’s ongoing work. The various explanations differ substantially in their predictions. Some elastic-scattering scenarios run into constraints from the low-energy data, while other inelastic models define an allowed energy range. Higgsino interpretations can be tested against the high-energy region, and the seasonal scenario links the event rate to the time of year. In such tests, an empty region of the detector can prove just as informative as a new event. Experimental physics, after all, quite often obtains a result precisely where an instrument has seen nothing.
New data will reveal what actually happened inside the LZ detector. If this was indeed an interaction with a dark matter particle, it could prove to be one of the most important discoveries in modern physics. If the cause turns out to be a previously unknown background process or another phenomenon, we will still learn more about nature than we did before. In science, the search for one thing has often led to the discovery of something entirely different and new.
For me, that is perhaps the greatest value of events like this: even when they provide no immediate answer, they move science forward by compelling us to refine our models, conduct new experiments, and expand the boundaries of what we are capable of seeing and understanding. And every such step reminds us that the more we learn about the Universe, the more clearly we recognize the vast scale of everything that still remains to be discovered.
Sources
- LZ Collaboration (D. S. Akerib et al.). Search for dark matter particle interactions in an extended nuclear recoil energy window with the LUX-ZEPLIN (LZ) experiment. arXiv:2609.02823 (2026). Preprint.
- LUX-ZEPLIN. The LZ Dark Matter Experiment. Official experiment website.
- Berkeley Lab News Center. LZ Sees Surprising Result in Search for Dark Matter. 1 September 2026.
- F. Zwicky (1933). Die Rotverschiebung von extragalaktischen Nebeln. Helvetica Physica Acta 6, 110–127. English and Spanish translation by H. Andernach (2017), arXiv:1711.01693.
- E. Corbelli, P. Salucci (2000). The extended rotation curve and the dark matter halo of M33. Monthly Notices of the Royal Astronomical Society 311, 441–447.
- V. C. Rubin, W. K. Ford Jr. (1970). Rotation of the Andromeda Nebula from a Spectroscopic Survey of Emission Regions. The Astrophysical Journal 159, 379–403.
- Planck Collaboration (2020). Planck 2018 results. VI. Cosmological parameters. Astronomy & Astrophysics 641, A6.
- R. J. Cooke, M. Pettini, C. C. Steidel (2018). One Percent Determination of the Primordial Deuterium Abundance. The Astrophysical Journal 855, 102.
- D. Clowe, M. Bradač, A. H. Gonzalez, M. Markevitch, S. W. Randall, C. Jones, D. Zaritsky (2006). A Direct Empirical Proof of the Existence of Dark Matter. The Astrophysical Journal Letters 648, L109–L113.
- S. S. McGaugh, F. Lelli, J. M. Schombert (2016). The Radial Acceleration Relation in Rotationally Supported Galaxies. Physical Review Letters 117, 201101.
- S. A. Cookson, I. Banik, K. El-Badry, W. Sutherland, Z. Penoyre, C. Pittordis et al. (2026). A Quality Framework for Testing Gravity with Wide Binaries: No Evidence for MOND. Monthly Notices of the Royal Astronomical Society 547 (2), stag342.
- D. S. Akerib et al. (LZ Collaboration) (2020). The LUX-ZEPLIN (LZ) Experiment. Nuclear Instruments and Methods in Physics Research Section A 953, 163047.
- J. Aalbers et al. (LZ Collaboration) (2025). Dark Matter Search Results from 4.2 Tonne-Years of Exposure of the LUX-ZEPLIN (LZ) Experiment. Physical Review Letters 135, 011802.
- K. Freese, D. P. Theodosopoulos (2026). Higgsino Dark Matter Interpretation of the LUX-ZEPLIN 248 keV Nuclear-Recoil Event. arXiv:2609.01583. Preprint.
- N. L. Rodd, B. R. Safdi, T. R. Slatyer, W. L. Xu (2026). Confronting the Higgsino Interpretation of the LZ Event with the High-Energy Sideband. arXiv:2609.04175. Preprint.
- C. McCabe (2026). Seasonal dark matter from the LUX-ZEPLIN high-energy event. arXiv:2609.04181. Preprint.