Drought and Heat Together Cost Global Wheat More Than Either Alone
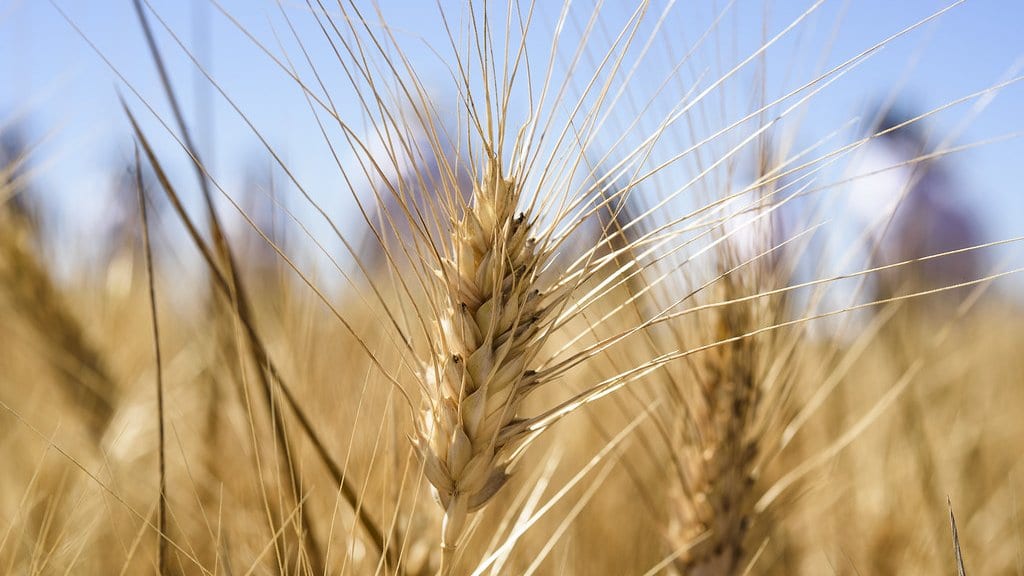
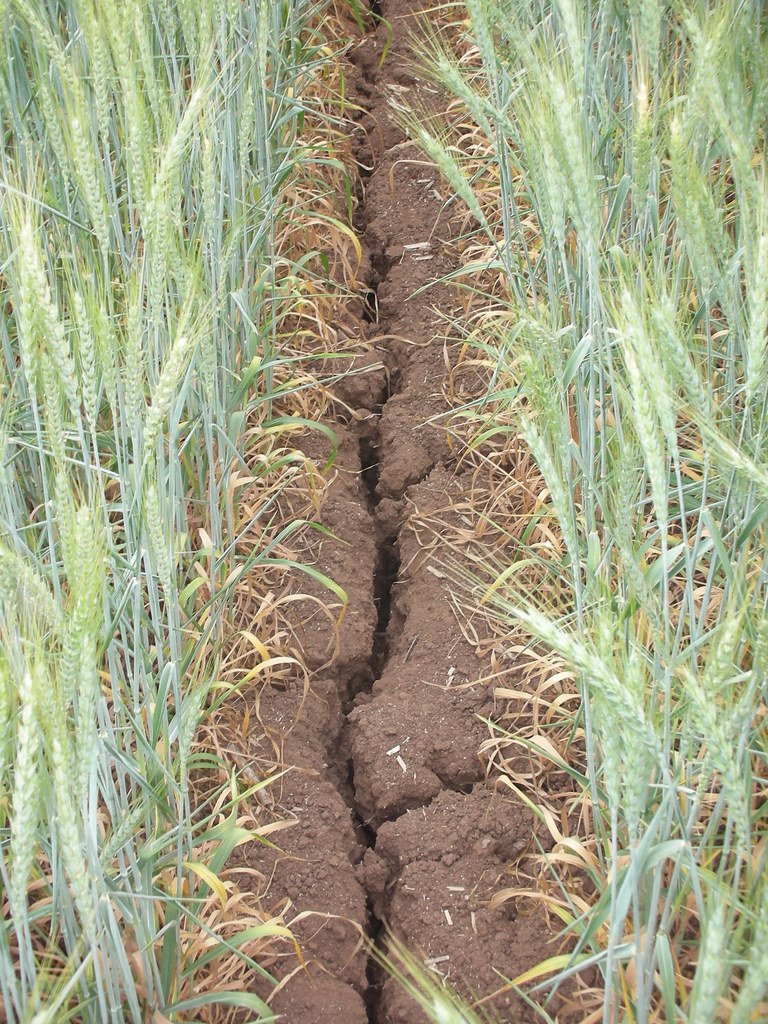
A rebuilt global crop model puts the wheat lost to drought at 9.7% of yield on average, the loss to heatwaves at 5.8%, and the loss in seasons when heat and drought arrive together at 13.3%. Yuchuan Luo of Southwest University, Zhao Zhang of Beijing Normal University, and colleagues report the figures for 1981 to 2015 in Nature Food, published Oct. 8, 2026.
The authors say the aim of the study is to give crop models a firmer grip on what extreme weather does to food production, and that the framework should support climate-risk assessment and the design of adaptation measures. The three loss figures are what their model calculates for those years, not a direct field measurement.
The team rebuilt both the internal structure of an existing crop model and the values it is tuned with, then ran it globally at a resolution of 10 kilometers. On the team's own comparison, the reworked model matched recorded yield losses more closely than a multimodel ensemble, a set of several crop models run together. The improvement ranged from 30% for droughts to 7% for the two extremes arriving at once.
The authors report that irrigation offsets part of the damage, and that its offsetting effect has weakened markedly as droughts and heatwaves have intensified.
The code for calibrating the model and for identifying extreme events and assessing their impacts is posted on Figshare, and the source data behind each of the paper's main figures is published with it.
Fulu Tao of the Chinese Academy of Sciences is a corresponding author alongside Zhang, and Jonas Jägermeyr of the NASA Goddard Institute for Space Studies is a co-author. The work was funded in part by the National Key Research and Development Program of China and by the International Partnership Program of the Chinese Academy of Sciences.
Sources
- Nature FoodPeer-reviewed