Germany Is Projected to Get Fewer Rain-On-Snow Floods, and Harder Ones Where They Spread

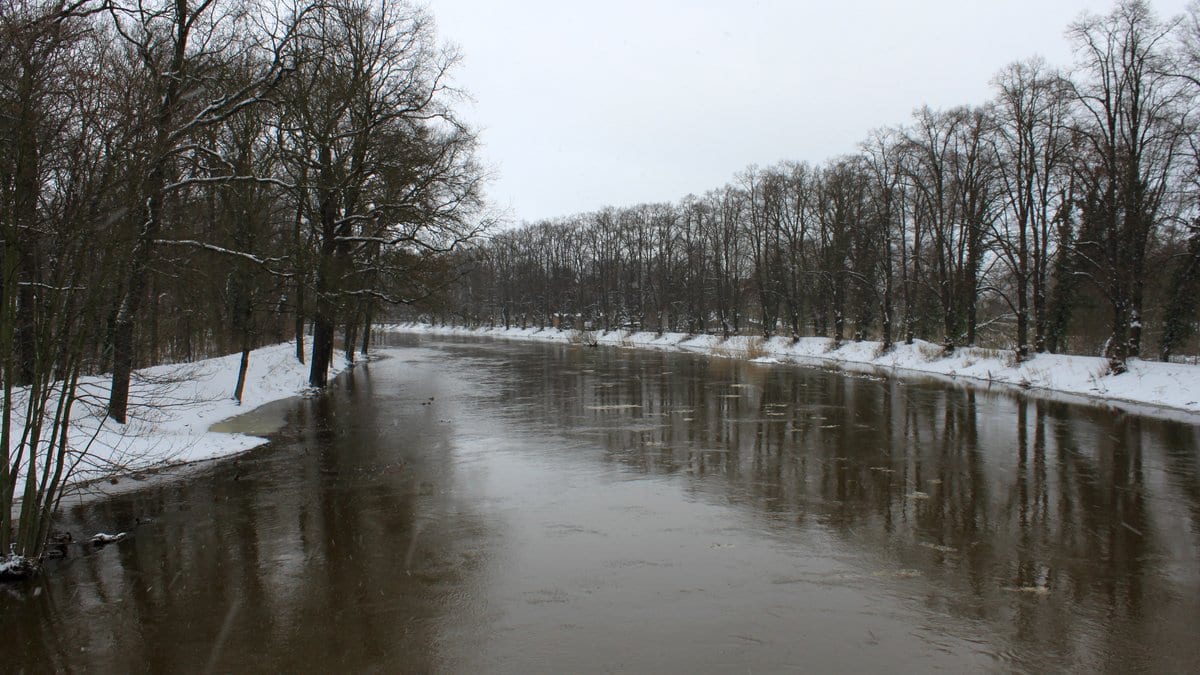
A snowpack is a reservoir that nobody built and nobody controls. Lay warm rain on top of one and it does not soak the water up: it passes the rain through and adds its own. The river downstream receives far more water than the sky delivered. In Germany that combination, rain falling on lying snow, has assembled some of the most destructive winter floods on record, and most of those that hit many catchments at once rather than a single valley.
So what becomes of that combination in a country that is running out of snow?
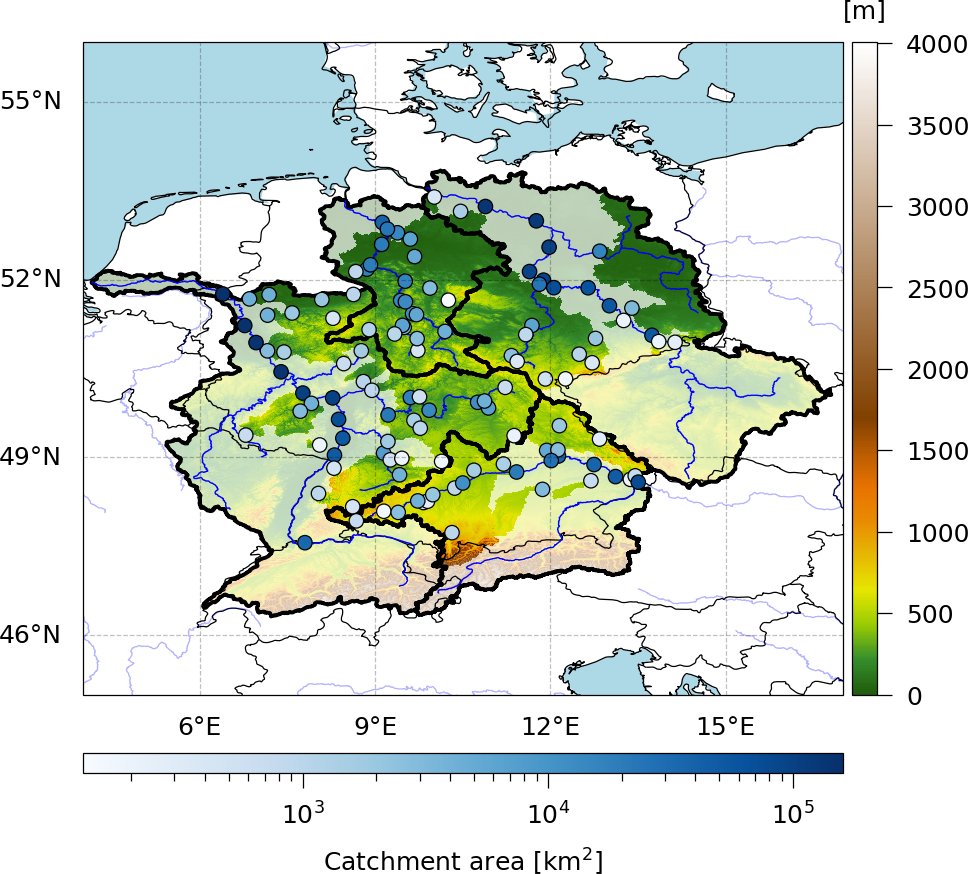
Christian Czakay and Bodo Ahrens of Goethe University in Frankfurt, with Larisa Tarasova of the Helmholtz Centre for Environmental Research in Halle, put the question to a model. Their study, published Nov. 5, 2026, in Natural Hazards and Earth System Sciences, simulates daily river flow at 96 gauges in the German parts of the Rhine, Danube, Elbe and Weser basins. The simulation runs from 1950 out to 2100 under RCP8.5, the high-emission pathway, and the only scenario the team ran.
Reading a flood that never happened
Simulating the water is the easy half. Saying what made each flood is the hard one, and it is why the paper leans on a neural network instead of a conventional hydrological model. The authors trained one set of networks per gauge, 10 independently trained copies, to reproduce decades of measured discharge from daily weather alone: temperature, rain, snowfall, snowmelt, lying snow, runoff and day length. Then, for every simulated peak, they used integrated gradients, a method that traces a prediction back to the inputs that drove it, and read off whether rain or meltwater had carried more of the weight.
That is an attribution of the network's answer, not a measurement of the river. The authors check it against an independent classification built from finer precipitation data, and they say where the two part company. The reanalysis supplying their weather is coarse enough that it shows a trace of snowmelt beside almost every peak the other method calls purely rainfall-driven. One gauge of the 97 selected was dropped outright: at the Müglitz at Dohna, two flood-control reservoirs built in recent decades have broken the link between the weather and the discharge, and the network barely worked there, scoring 0.09 on a skill measure where 1 is perfect.
Fewer floods, and made of different water
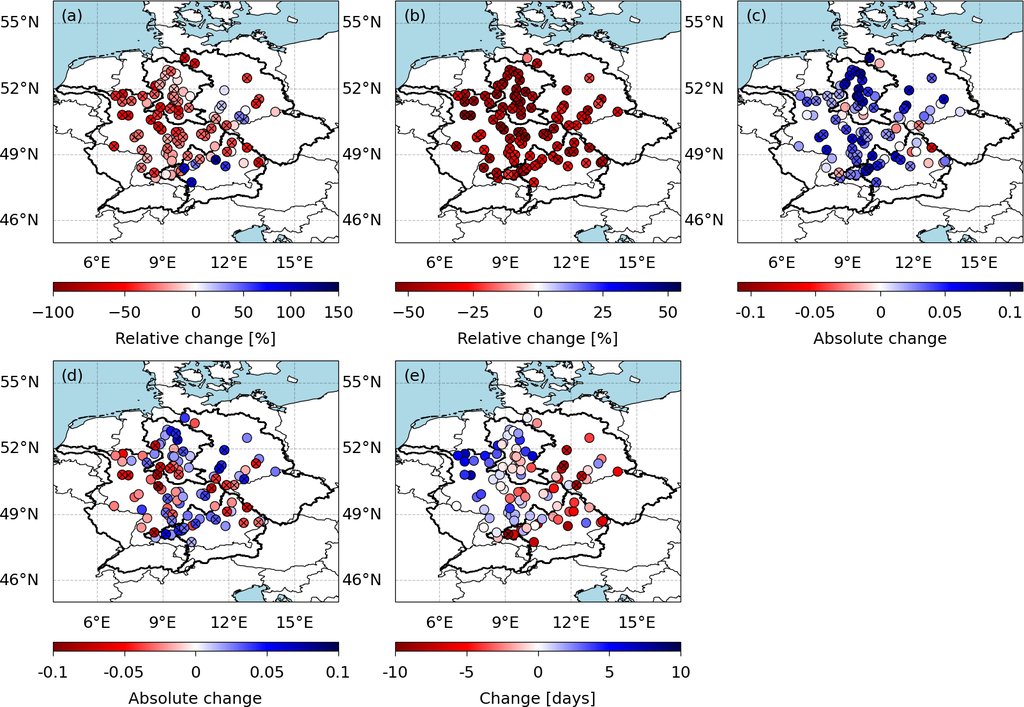
Across the 31 combinations of global and regional climate models driving the simulations, the middle of the spread has rain-on-snow floods becoming less common at most gauges in the 2041–2100 period, measured against 1951–2010. The paper's abstract puts that fall at up to 60%, which is the steepest decline at any single gauge, not a number for the country. Across gauges the middle of those 31 runs ranges from that same 60% fall to an 80% rise, one Danube gauge gains up to 113%, and over the full span of models the band is wider still, from a 78% fall to a 175% rise. The gauges that gain are the higher ones, in the northwestern Danube and the midwestern Elbe.
That split by elevation is not new. A 2018 study in Nature Climate Change led by Keith N. Musselman found the same shift over western North America, with high ground gaining rain-on-snow floods as low ground loses them.
What barely varies between models is the recipe. The weight the networks put on snowmelt falls at every gauge in every period while winter rain rises, so the floods that remain are increasingly rain floods with some snow in them rather than snow floods set off by rain. A flood counts as widespread here only if it crosses more than a tenth of a basin's gauged area. At that scale the share of floods qualifying as rain-on-snow drops from around 80% to around 40%, even as the total number of widespread floods keeps climbing. The Danube is the exception. Its share stays near 80%, and it is the one basin where widespread rain-on-snow floods grow steadily more frequent in every period, which is a statement about how often and about nothing else.
Worse, with no number attached
The severity result is the most careful thing in the paper. The networks reproduce when floods happen well and how big they are badly: mean annual maxima come out low by up to 50% in the middle of the 31 runs. A model like that cannot be asked by how many cubic meters a future flood will beat a past one. So the authors ranked every simulated rain-on-snow flood across the whole run and scaled the ranks gauge by gauge: 0.5 is an average flood, 1 the most intense. "Although it is not possible to provide a quantitative statement on the change in severity, it is still possible to analyse the trend and its direction," they write.
The direction is up. "The maximum rank of ROS floods is projected to be higher for all basins in all future periods," the conclusions state, using the paper's shorthand for rain-on-snow. The mean and the most extreme widespread events rank above the reference period in all four basins, the Danube included. At individual gauges the mean rank rises almost everywhere. The highest rank rises mainly in the western Danube, the western Elbe and the middle and northern Weser, and falls across most of the Rhine. For that last period the rise is not statistically significant for the Elbe, nor for the four basins pooled, nor, for the maximum rank, for the Weser.
And the models disagree far more than their ingredients do. "Despite the overall agreement in the trends of the input features across climate models, the resulting trends in ROS floods are considerably disparate," the authors write. Snow is why. It emerges from a long chain of land-surface schemes and biases, and the melting season in two of the regional models starts 30 to 50 days later than in a third. For a process that switches on a threshold, that is enough to decide whether a peak is logged as melt or as rain. Their conclusion is a methodological one: a question like this needs a whole ensemble of models, not one of them.
The authors name two limits themselves. Everything here rests on RCP8.5, and they note that the high-impact scenario for the newer generation of climate models is the less pessimistic SSP3-7.0, under which their 2041–2100 changes could come out smaller, nearer what they find for 2011–2070. And a rank gives a direction, never a depth. What they have put within reach of anyone who wants to test it is the material: the simulated discharge, the trained networks and the attribution values, deposited openly.