Why Short Rain Records Mislead Flood Planners, and a Fix That Holds up in a Warming Climate

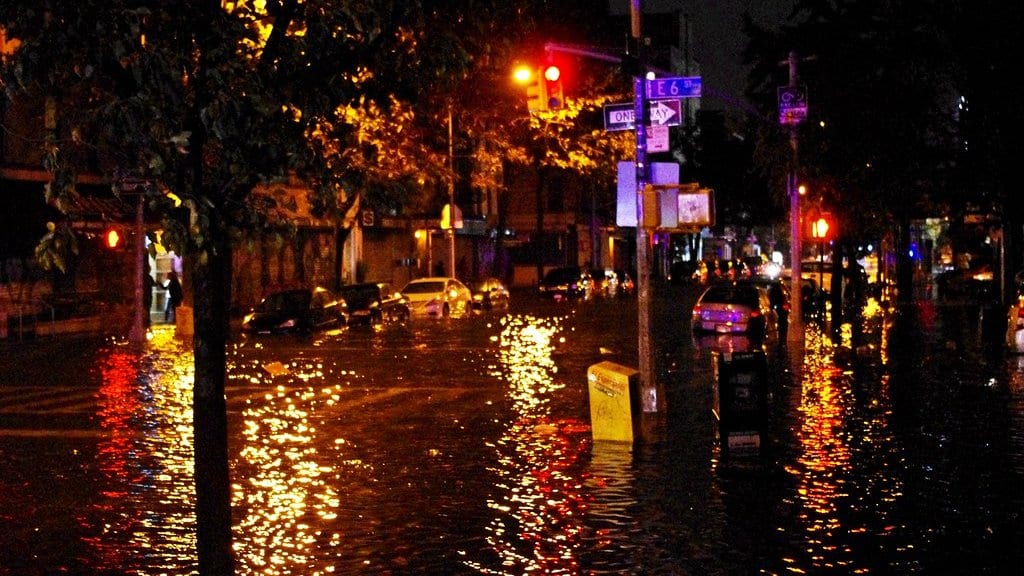
Ask a hydrologist what a "hundred-year" downpour looks like for a given town, and the honest answer is that they are guessing from thin evidence. A rain gauge that has been running for thirty years has, by definition, seen at most thirty annual maxima: thirty data points from which to infer an event that, on paper, should arrive once a century. Stretch that inference to the most violent hour of rain a place can produce, the kind that overwhelms culverts and turns streets into channels, and the statistics get shakier still.
That fragility is the target of a study published on 15 July in Natural Hazards and Earth System Sciences by Marc Lennartz and Bruno Merz of the GFZ Helmholtz Centre for Geosciences in Potsdam, with Benjamin Poschlod of the University of Hamburg (Lennartz et al., 2026). Their question is narrow but load-bearing: when you only have a short record, which statistical method gives you the least-wrong estimate of extreme hourly rainfall, and does the answer change once you factor in a warming climate?
Two ways to read the tail
The default tool across much of engineering hydrology is the Generalized Extreme Value distribution, or GEV. It works by throwing away almost everything: from each year of data it keeps a single number, the wettest hour, then fits a curve to that thin string of annual maxima. It is simple and well understood, but a curve anchored on thirty points is easy to knock off course.
The alternative the team tested, the simplified metastatistical extreme value distribution (sMEV), is greedier with data. Rather than one value per year, it gathers all the "ordinary" rain events (spells separated by at least twelve dry hours) and fits their behaviour, using the bulk of storms to constrain what the rare ones might do. More information goes in, so the estimate wobbles less.
To pit the two against each other with something closer to ground truth, the researchers turned to a convection-permitting climate model: COSMO, run at roughly three-kilometre resolution over a domain centred on Germany and reaching from lowlands to the Alps. That resolution matters: it is fine enough to simulate the convective cells that produce the most intense summer cloudbursts, rather than smearing them out the way coarser models do. Driven by the MIROC5 global model under a high-emission scenario, it generated three thirty-year windows: a 1971–2000 baseline, a mid-century slice, and an end-of-century one. Those gave the team long synthetic records they could deliberately chop short to test each method's nerve.
The short-record verdict
On the central question, the result is clear. Across almost all return periods and record lengths, sMEV held up better than GEV when the sample was small. Asked to estimate a 100-year rainfall from just thirty years of data, sMEV posted a relative error of about 12.5 percent; GEV came in around 34.6 percent, roughly triple. For the rare, high-return events that flood planning cares about most, and the short records planners usually have, that is a large and practical margin.
In today's climate, GEV tends to read hourly extremes a little higher than sMEV. Under warming, the ordering flips. GEV projected extreme hourly rainfall intensifying at about six percent per degree of warming; sMEV put it nearer eight percent for ten-year events and ten percent for hundred-year ones, closer to the Clausius–Clapeyron expectation of roughly seven percent more moisture per degree that thermodynamics predicts for a warmer atmosphere. If sMEV is the better guide, some current standards may be leaning on a scaling rate that runs low.
There was a geographic wrinkle, too. The gap between the methods followed a north–south gradient across Germany: in the oceanic north, where rain comes in frequent but gentler bursts, GEV read the extremes higher, while in the more convective south sMEV did. That split widened in the warmer future runs.
A warning, not a forecast
The whole comparison runs through a single model chain (one regional model driven by one global model under one emission scenario), so the numbers are conditional on that setup rather than a survey of the possibilities.
For anyone who sets those standards, the method you reach for is not neutral. On short records, and in a climate that is no longer holding still, it can be the difference between a system built for the storm that is coming and one built for the storm that already passed.
Sources
- Natural Hazards and Earth System SciencesPeer-reviewed