The Faults Under Israel's Offshore Gas Corridor Have Moved Ten Times Faster Since the Ice Age Ended

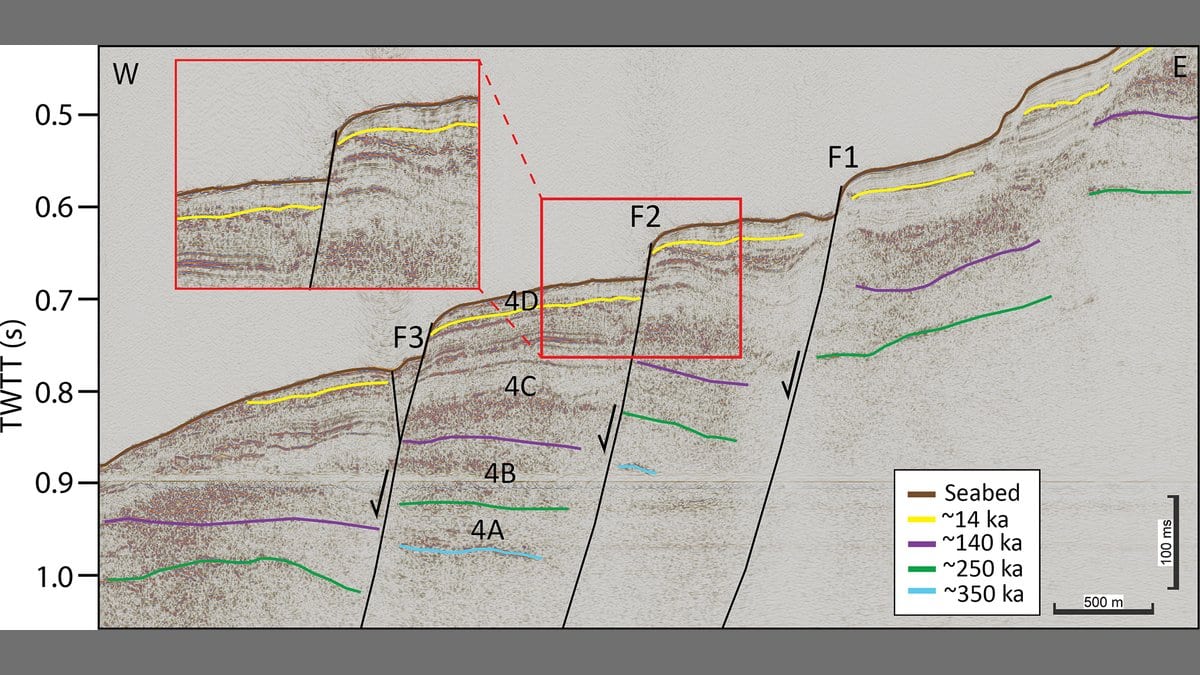
Somewhere off northern Israel, under a few hundred meters of water, the seabed has a step in it roughly 30 meters high. By rights, it should be gone. Sediment carried up from the Nile settles along this margin fast enough to smother a scarp that size several times over, so a step still standing means something has been pushing it up lately, and faster than anyone had written down.
How much faster is what a peer-reviewed paper published Aug. 26 in Natural Hazards and Earth System Sciences sets out to answer, and the answer is a factor of ten. The work comes from May Laor of the Geological Survey of Israel and the Hebrew University of Jerusalem, Zohar Gvirtzman of the same two institutions, and colleagues at Haifa University. Nothing about the faults changed between the old number and the new one. What changed was which layer of buried mud the measurement was taken from.
Offshore fault hazard is worked out by division. Pick a buried sediment layer whose age is known, measure how far the fault has shifted it, and divide one by the other; the result is an average slip rate an engineer can design a pipeline against. On land, the layer of interest can be reached with a trench. At sea, it has to be a layer visible in seismic reflection data, and in practice that means one tens or hundreds of thousands of years old. The arithmetic is honest. The window is enormous.
Israel's national infrastructure corridor, the seabed route carrying gas to onshore power plants, crosses a set of curved normal faults that slide on a layer of salt buried about a kilometer down. A 2023 study by two of the same authors sorted the region's faults by hazard and put the most active group at about 0.25 millimeters a year, measured against a horizon 350,000 years old.
In June 2021, the team ran a sub-meter sparker survey over the same ground, sharp enough to separate layers a few tens of centimeters apart. That resolved a horizon dated to about 14,000 years, the surface left as the last glacial maximum ended, and the sea began to come back. Measured across that layer, the four faults studied have averaged 2.4 millimeters a year since.
How much weight the number will bear
Two things make the tenfold difference hard to argue away. Both averages are a measured offset divided by a span of time, so neither depends on how much the sediment has compacted since it was laid down; the correction that usually complicates this kind of reconstruction simply cancels out. And the team stressed its own assumptions, shifting the seismic velocities used to convert travel time into depth, then inflating the older displacements by more than the observed loss of porosity would justify. The trend held both times.
The four faults were picked as representatives of the region's most active group, and they are not the whole margin. The faults farther downslope, sitting above the thicker salt, peaked millions of years ago and have been slowing ever since. The acceleration belongs to the upslope group, which is the group the pipelines cross.
What a 14,000-year average cannot tell you
2.4 millimeters a year is not a present-day speed. It is an average over 14,000 years, and the paper gives a whole figure to the two ways that average could have been assembled: a peak early in the Holocene, when the sea was rising fastest, or a peak now. The first would be a relief for hazard planning. The second would make it worse. The data cannot yet tell them apart, and the authors do not pretend otherwise.
The 30-meter step suggests the recent past was livelier still. Steady slip at the new rate, set against how quickly sediment buries things here, should have left a step of roughly 7 meters since the ice melted, and the real one is several times that. The authors read the mismatch as a sign that most of the step was built in a single very recent episode, possibly within historical times: an inference, they note, drawn from a survey that still cannot say whether these faults creep steadily or lock and rupture.
The returning sea, and why it is still a suspect
That leaves the question of what changed when the ice sheets melted, and the paper's candidate is the water itself. Sea level rose about 120 meters. Loading a continental shelf with that much water raises pore pressure inside fine-grained sediment faster than it can drain away, and higher pore pressure means less friction holding a fault shut. Modeling by other groups has found the post-glacial rise large enough on its own to push existing faults closer to failure. Extending their measurements back through two earlier glacial cycles, the team reports what it calls a noticeable correlation between sea-level swings and fault motion.
That correlation leans partly on horizons nobody has dated. Two anchors are fixed: the 14,000-year surface and the 350,000-year one. The two layers in between are matched to drops in a global sea-level curve rather than measured, which makes the older half of the comparison partly an expression of the idea it is testing. The authors are careful with the language throughout. They raise the hypothesis, they call the pore-pressure route possible, and their conclusion states that further geotechnical measurements in the seabed itself are required to confirm the causal link and to distinguish it from other forcing factors. Nobody has made those measurements. Sea level has also been roughly stable for the past 7,000 years, so any slip inside that window needs either a delayed response or a different cause altogether.
What survives the hedging is the methodological point, and it is portable. Any margin where fault speed is read off a deep, old horizon may be reading an average that flattens everything the fault has done since the ice melted. The recommendation is to pick post-glacial markers instead, particularly around the Mediterranean, where buried salt keeps this style of faulting going, and then to go after the Holocene layers themselves with ultra-high-resolution seismic and dated cores. That is the measurement that would say whether these faults are still speeding up or have already had their peak.
Sources
- Natural Hazards and Earth System SciencesPeer-reviewed
- doi.org