A Landslide Map That Follows the Debris Downhill

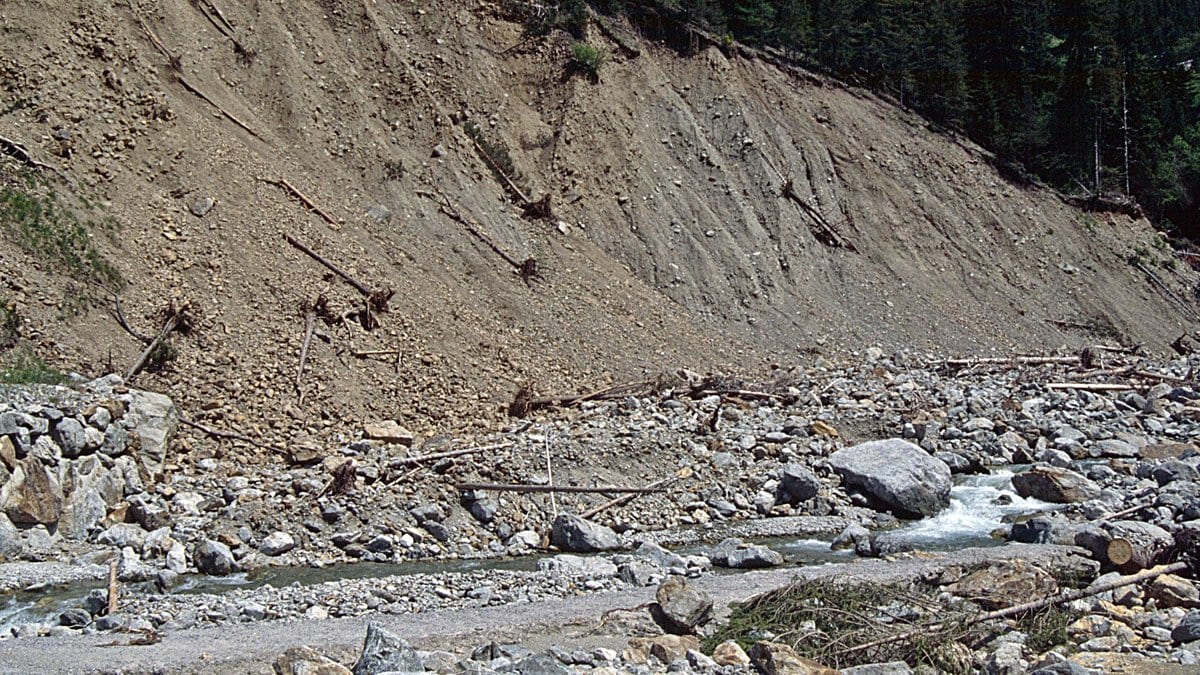
A landslide susceptibility map answers one question well: which slopes might give way. It is silent about the next thirty seconds, when the soil that gave way is moving downhill toward a road, a village or a river.
Filling in that second half is the point of COHESION, a modeling framework published Nov. 20, 2026, in Natural Hazards and Earth System Sciences. Rafael Jan Pablo Schmitt of the University of California, Santa Barbara, Shikshita Bhandari of Stanford University and two colleagues built it to run across a whole river basin on mostly global data, and tested it on the Kaligandaki, a 7,573-square-kilometer catchment in central Nepal where more than half a million people live.
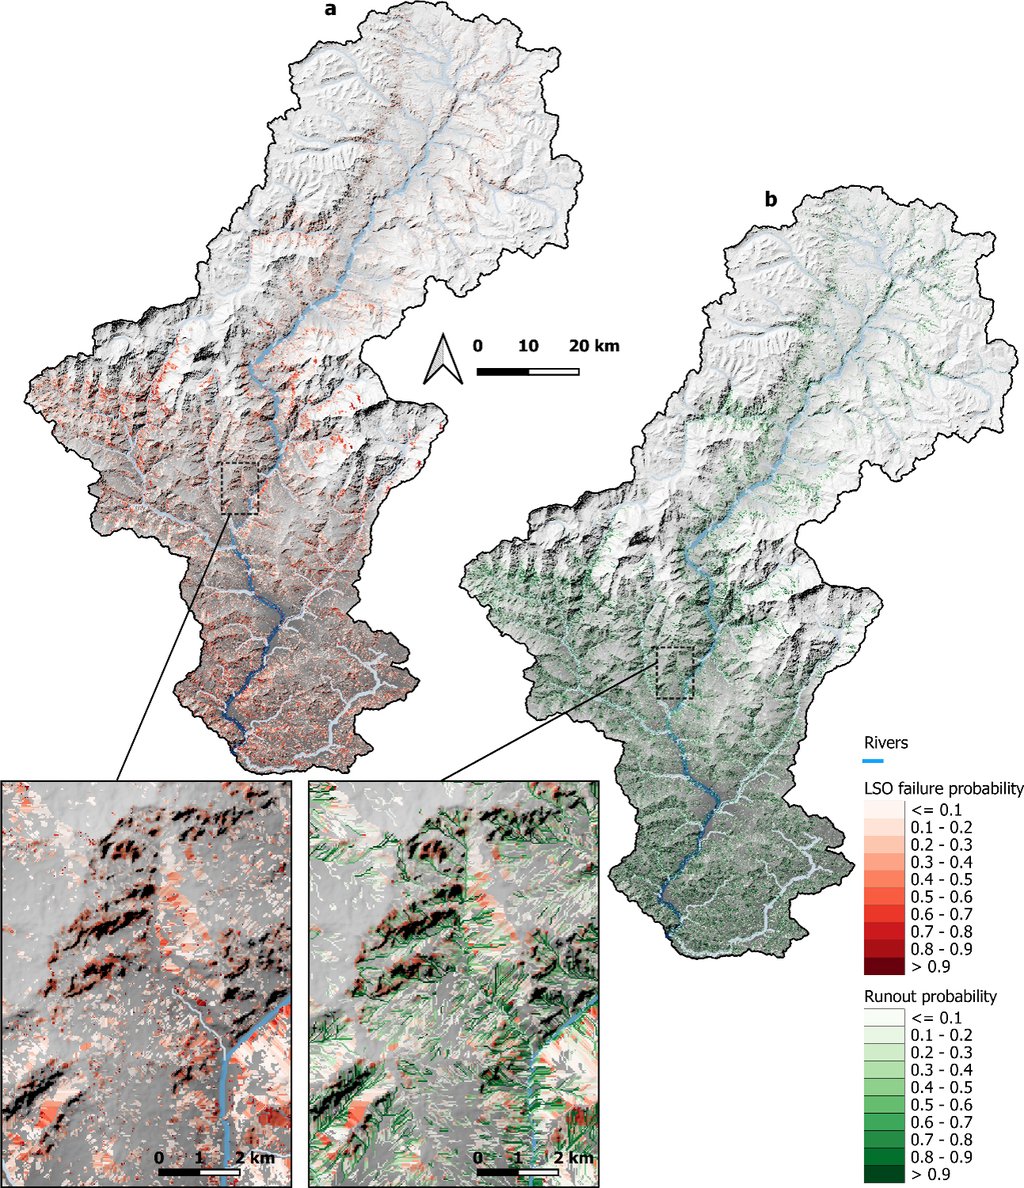
Conventional susceptibility maps work cell by cell. Each square of a digital elevation model gets a stability score, and neighboring squares know nothing about one another. COHESION keeps that step, then groups the unstable cells that drain into each other into single landslide objects. Grouping matters because a landslide's mass rises faster than its area, and mass is what sets how far the debris travels. From each object the model estimates a volume, draws the runout (the corridor that debris would follow downhill), and marks where that corridor crosses a stream.
In the Kaligandaki the model delineated 1.06 million potential landslide objects, of which about two in three have any chance at all of failing under the rainfall the basin actually gets; everything that follows is computed on that subset. Tracing their runout corridors widens the mapped hazard footprint by 53.3% over the source areas alone. Most individual corridors are a few hundred meters long — short, and short is enough in valleys where houses sit directly beneath slopes.
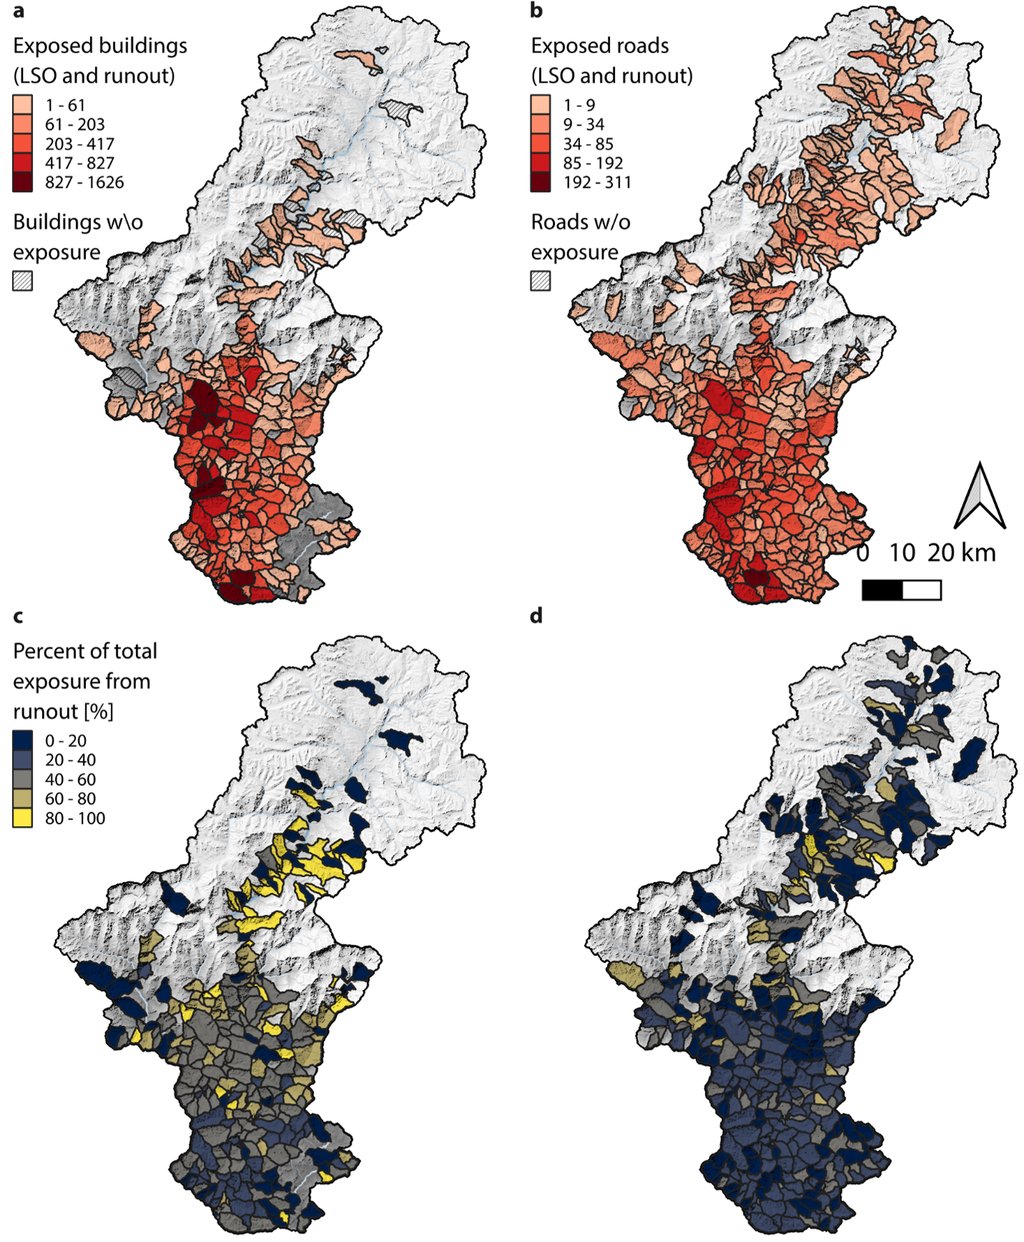
Exposure is where the second half of the map changes the answer. Of the basin's 9,682 mapped road segments, 6,465 sit on slopes the model flags as liable to fail, and more sit in the corridors below other slopes. Those are OpenStreetMap segments rather than kilometers, and the paper never converts between the two. For buildings the pattern inverts, and counting runout adds far more exposed houses than exposed roads. The authors explain the split plainly: settlements tend not to be built on the steepest ground, and roads cross it.
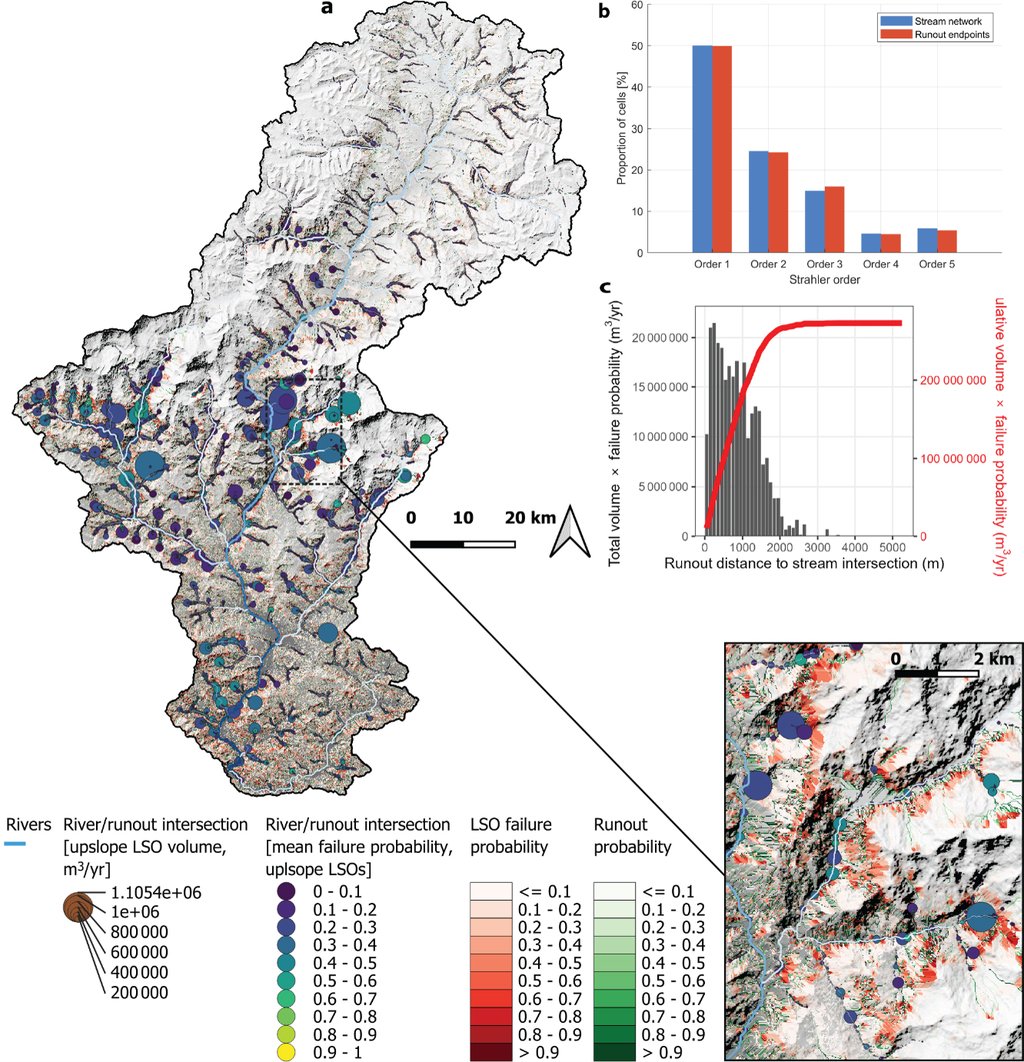
Following the debris also shows where hillslopes feed rivers. Runout from roughly a third of the objects with any chance of failing reaches the river network at 30,747 distinct points, more than half of them on the smallest headwater channels.
Everything downhill of the grouping step rests on an estimate of mass, and that estimate comes from a published relationship between a landslide's area and its volume, fitted to thousands of scars worldwide. Volume sets how far debris runs, and how far it runs sets the headline figure. The journal's peer review is open, and two of the three referees went after exactly that route: Takashi Kimura raised as a major concern that the mass implied by the scaling need not match the failure depth the stability step assumes, and Anatoly Tsyplenkov noted that the runout relation was originally derived for debris flows. The published version answers them with a paragraph of limitations; the volumes were not recomputed. The authors state the bound themselves: "Runout pathways should thus be interpreted as screening-level corridors rather than an exact delineation of runout hazard."
The model was tuned against a satellite inventory of landslides mapped in the same basin, and the match is a match of distributions: where modeled failures sit across the range of slope angles, against where observed ones do. Allowing for the error in mapping, it misses 12% of the inventoried failures outright. The runout footprint, which is the part this framework adds, is not tested against observed runout anywhere in the paper.
One line of argument came out of the model being wrong. Multiplying each object's volume by its rainfall odds yields 63.8 millimeters of erosion a year across the basin, against the 1 to 2 millimeters a year reported for Nepal from landsliding. A slope cannot fail again until its soil comes back, the authors reason, and allowing realistic rates of soil formation brings the modeled figure down below a millimeter a year, into the range that has actually been measured. From that they propose that what limits landslide sediment is how fast soil rebuilds, not how often it rains hard.
The model marks 31% of the basin as ground that could fail if it got wet enough, which sits inside the national picture: in 2024, Kincey and colleagues mapped 77% of Nepal's land surface as susceptible to landsliding to some degree. The connectivity result has an older comparison that cuts both ways. After the 2008 Wenchuan earthquake in China, Li and colleagues counted which landslides reached channels, then found that the fine sediment the rivers carried afterward tracked landslide density about equally well whether connectivity was counted or not. Mapping the connection is not the same as measuring what moves along it.
What the framework hands a planner is a filter. The model code is openly deposited under a CC BY license and the inputs are mostly free global datasets, which is what makes the approach portable to other basins; the output maps are available from the corresponding author on request. Nepal has identified close to 600 hydropower projects for possible development, and one of its largest plants already sits at the outlet of this basin. For anyone deciding which valley to survey first, a list of the places where a hillside could reach a river is a different kind of document from a map of unstable slopes.