An Earthquake's Hazards Come as a Chain. A New Model Keeps It Whole.

A large subduction earthquake is not one hazard; it is a sequence. Shaking comes first. Wet sandy ground can liquefy under it, and liquefied ground near a riverbank slides sideways. Hillsides let go. And if the seafloor moves enough, water follows.
Napier sits on the east coast of New Zealand's North Island, and it has every link in that chain. Loose sediment over a high water table. Rivers and drainage channels through the suburbs. Hills behind the town, and an open shore facing the trench where the Pacific Plate dives beneath the Australian Plate, the kind of boundary that produces the largest earthquakes on Earth.
Risk assessments usually take that chain apart. Each peril gets its own model, and the answers are combined at the end. Jose Moratalla and nine colleagues at Earth Sciences New Zealand, in Lower Hutt, argue the work should run in the other order. On Oct. 27, 2026, they published a framework in Natural Hazards and Earth System Sciences that keeps the chain whole. One rupture is drawn from a synthetic catalog of 100,000 years of Hikurangi Subduction Zone earthquakes and carried through five hazards down to the damage at individual houses, with the uncertainty handed from each step to the next rather than generated afresh at every stage.
The paper's own word for this is "fully correlated." Every secondary hazard in a simulated earthquake is computed from that same earthquake's fields. The shaking footprint generated for the rupture is what drives the liquefaction severity, the sideways displacement and the landslide probabilities, while the tsunami is modeled from the rupture's own slip. Nothing is drawn separately and matched up later. The approach, the authors write, "reduces artificial variability introduced by independent sampling," and it "differs from the more common approach of modelling each hazard independently and combining the results afterwards."
That is the authors' reasoning rather than a measured result. The paper runs no side-by-side test of a correlated chain against independently sampled perils, and it reports no figure for the difference between the two. The paper says that direct comparison with earlier earthquake risk studies, or with damage observed after real earthquakes, "remains challenging," because most of those studies take one hazard at a time or report total damage without separating the interactions.
The city was chosen for its weaknesses
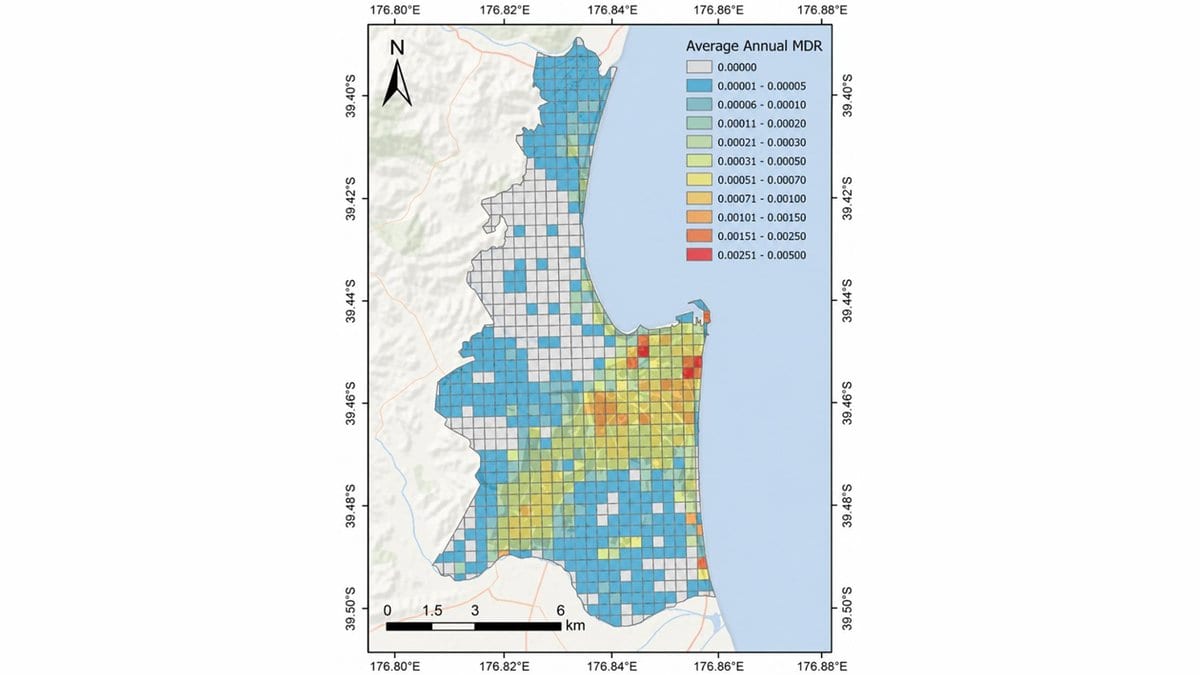
Napier was the pilot. The city sits directly above the Hikurangi interface, which the paper calls New Zealand's largest earthquake source, and about 30,000 of its houses were put through the model. The synthetic catalog was built in OpenQuake, an open-source hazard engine, from New Zealand's 2022 national seismic hazard model, with the subduction zone assumed capable of events up to magnitude 9.1. That figure is the paper's estimated maximum credible magnitude for the fault: a ceiling on what the source could produce, not a forecast of what it will.
Tsunami was the expensive part. A fine-resolution hydrodynamic model cannot be run for every rupture in a catalog that long, so the team built a library of 330 inundation runs instead, from ruptures with uneven slip spaced along the subduction zone. During the simulation, each earthquake takes the nearest matching case from that library. Napier's own coast does some of the work: elevated ground and large coastal gravel ridges keep small and moderate waves out.
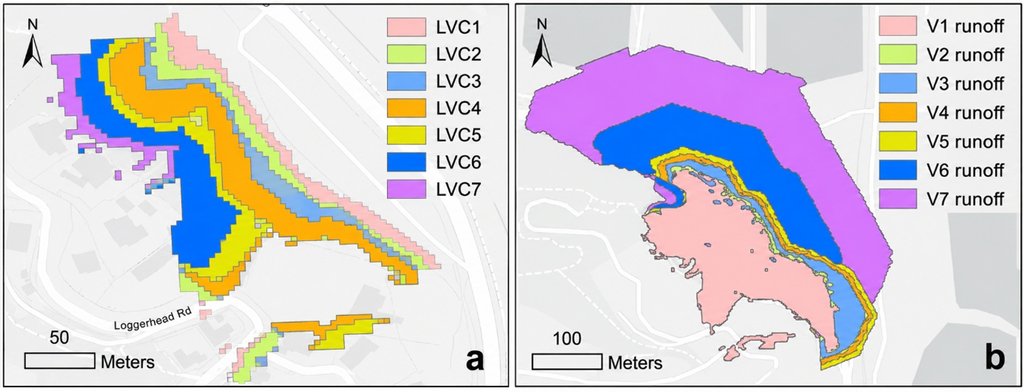
The ground-failure hazards are empirical. Liquefaction severity is sampled inside susceptibility zones mapped across the city and checked against cone penetration tests. Lateral spreading, where liquefied soil slides toward an open edge, is estimated from shaking, slope and the distance to the nearest channel bank. Landslides come from a national forecast tool that turns shaking into a probability of slope failure, with debris runout estimated by volume class, and a house counts as destroyed when the debris covers its whole footprint. Damage from all the perils is then mapped onto one common scale. The full catalog is simulated 200 times, and the published results are the median of those runs.
Where the tsunami stops being a rounding error
Over the whole catalog, ground shaking and liquefaction together account for about 60% of the average annual damage to Napier's houses. Lateral spreading accounts for a further 35% or so, and tsunami for less than 3%.
The average is not where the interesting part sits. The paper reports that beyond a return period of 10,000 years, tsunami losses become comparable to those from shaking and liquefaction. Inundation behaves like a threshold, mostly held off by the coast's topography until a rupture is large enough, and then contributing as much as the shaking does.
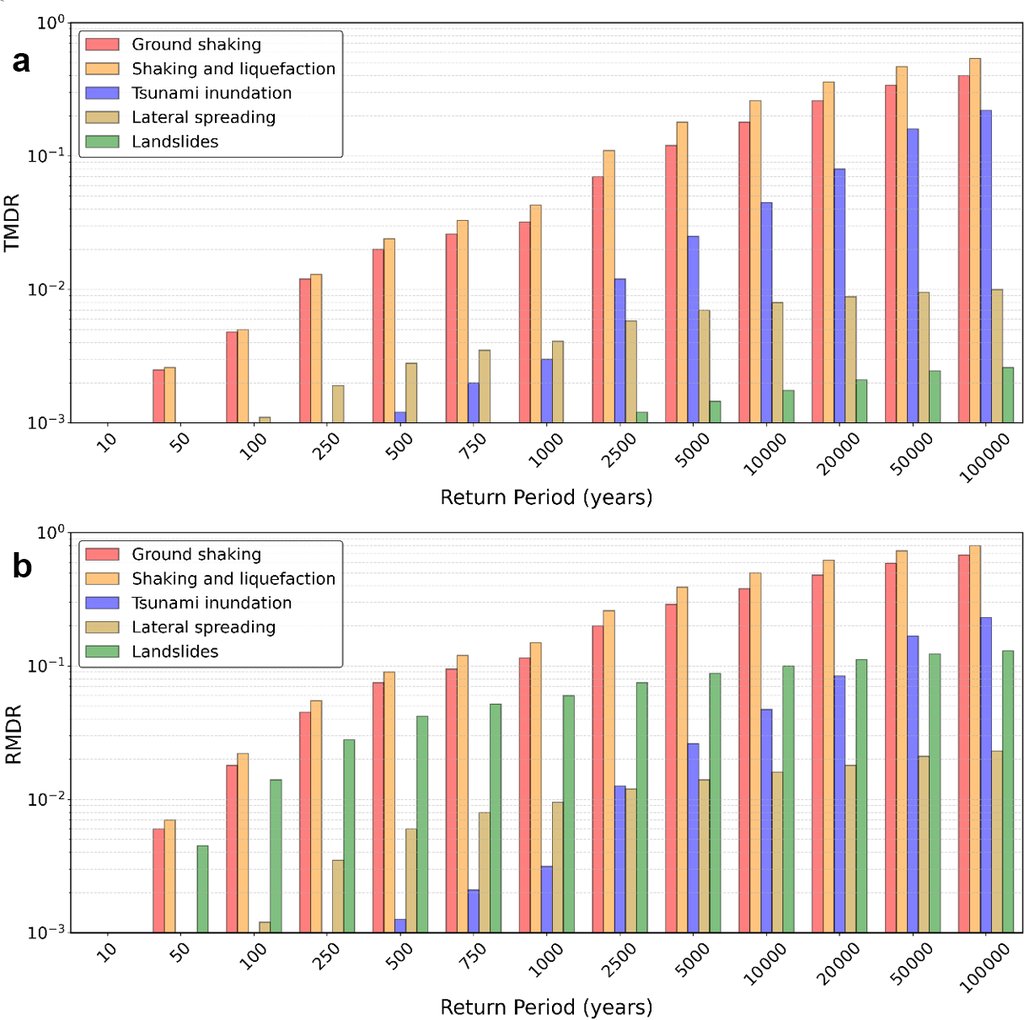
The same shape runs through the damage states. Slight damage appears in the results for return periods beyond about 100 years, extensive damage and collapse stay uncommon until past 500, and beyond 5,000 years they are the dominant outcomes. City-wide shares also understate local ones. Landslides are a small part of the total because few Napier houses sit where debris could reach them, but for the houses that do, the model has them taking real damage from return periods of 50 years upward. That is the distinction a land-use plan needs and a single city-wide number erases.
That ordering belongs to Napier. It follows from the city's loose sediment, its channels, its hill suburbs and its sheltering coast, and the paper does not offer it as a result for coastal cities in general.
What the chain does not carry
The framework's limits are largely the limits of what exists to put in it. Path dependence is missing: a house cracked by shaking is no more vulnerable to the tsunami behind it than an undamaged one, because damage curves for hazards arriving in sequence barely exist. The tsunami modeling leaves out debris, tidal stage, storm surge and sea-level rise. Landslides are triggered by shaking alone, with no rainfall or groundwater history. The factors that scale up shaking damage where ground liquefies came from a confidential study of Christchurch damage done for New Zealand's earthquake commission, so the authors cannot show how the factors were derived, and call for public, validated ones. Validating the whole chain is harder again, they write, because observational records of cascading earthquake hazards are scarce.
The review record is printed beside the paper: it was edited by Seda Yolsal-Çevikbilen and reviewed by four anonymous referees under the journal's open process, with the dates of submission, discussion and revision alongside. Code and data are available from the authors on request, through a private repository, while the methods are in the paper and its supplement. What the Napier run hands a planner, an emergency manager or an insurer is narrow and usable: the relative weight of each hazard, read off one calculation rather than five separate ones. The only ground truth the authors lean on is older than any of the models. Liquefaction's growing share as events get rarer, they note, matches what was observed after the 1931 Hawke's Bay earthquake.