A Tunnel Inside Germany's Highest Mountain Has Measured Its Ice for 17 Years

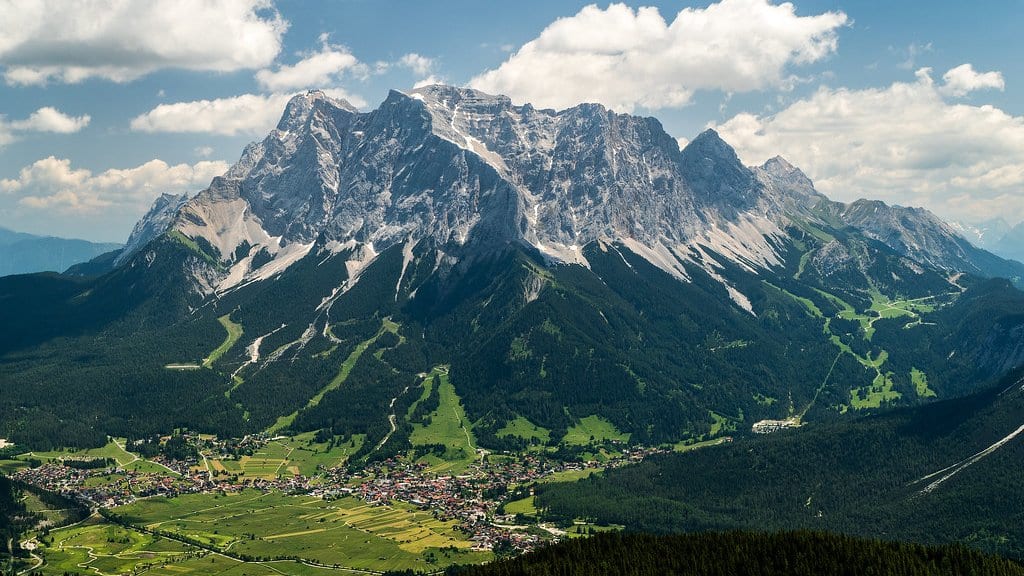
Once a month, someone walks into a private tunnel bored under the summit ridge of the Zugspitze, sprays salt water onto a line of steel electrodes fixed in the limestone, and sends an electric current through the mountain. The current is not really interested in the rock. It is interested in what fills the cracks: water conducts, ice resists. Measure how strongly the mountain pushes back and you have a map of where it is still frozen, in rock nobody could otherwise reach without drilling. Riccardo Scandroglio and Michael Krautblatter of the Technical University of Munich, with colleagues in Davos and Bonn, have now published the whole series in the peer-reviewed journal The Cryosphere.
The method itself is standard. Electrical resistivity tomography has been used on frozen ground for many years, because ice and liquid water differ so sharply in how they conduct. What is unusual here is the tunnel. Almost every other survey lays its electrodes on the ground surface and looks down, and resolution falls away with depth, exactly where the frozen core sits. The Kammstollen runs from a research station on the mountain's south side out to the north face, so the electrodes sit inside the frozen body, level with it, looking outward.
Most long-running permafrost surveys are done once a year, at the end of summer, when the thawed layer is at its deepest. This record is monthly, and that cadence turns out to matter. Rock temperature deep inside the mountain follows the outside air with a delay of up to 75 days, so a hot July arrives in the permafrost core in late September. A single annual reading cannot see that lag, and it misses the spring and early summer months when the rock's resistance falls fastest.
A decade of readings, and a quarter of the resistance gone
The trends in the study are all measured over the past decade, not across the whole record; the monthly series is complete for 10 years, and the authors keep the two spans apart. Over that decade the rock warmed by 1 °C. Its mean resistivity fell by 25%, the electrical signature of ice giving way to liquid water in pores and fractures. The permanently frozen part of the surveyed sections shrank by about 40%. The active layer, the skin of rock that thaws each summer and refreezes each winter, has been thickening: a sensor 10 meters in from the north face reached the melting point in the summer of 2023 and stayed there for more than two months.
About two-thirds of the frozen rock the survey can map is an outer shell, and it is that shell that is degrading fastest. Carrying its measured rate forward, the authors calculate, would mean the loss of 65% of the permafrost within a decade. They are careful with the wording: this is a straight-line extrapolation of a measured trend, not a model run and not a forecast. The physics underneath is not necessarily linear: latent heat, meltwater and snow cover make thawing lurch rather than glide.
The lab curve does not survive the trip to the mountain
The other half of the study is quieter and may matter longer. Turning a resistivity image into a temperature needs a calibration curve, and the curves in general use come from laboratory samples frozen under controlled conditions. Nobody had checked one against a real mountain. This team could, because rock temperature sensors sit at several depths beside the electrodes. Near the freezing point the laboratory curve holds up. Below freezing the rock in the mountain is far more resistive than the laboratory predicts, and the mismatch is not even uniform: sensors 5 meters apart yielded measurably different curves.
The authors' conclusion is blunt and useful to anyone doing this work elsewhere: a field calibration is strictly valid only for the spot where it was measured, and a laboratory curve should be checked against rock before its numbers are trusted. A second technical change came from measuring each reading twice, forward and backward. That showed the fixed error term the group had used since its first survey here was far too cautious. Shrinking it sharpened the images enough to bring out a fault zone cutting across the frozen body, a feature the earlier processing had smoothed away.
Where the heat could take a shortcut
That fault is why the study ends on a warning rather than a trend line. The degradation so far is driven by heat conducting inward from the surface; the summit's mean annual air temperature has run above its long-term average in nine of the last 10 years. But a fault zone that is frozen is effectively sealed, and a fault zone that has thawed is a plumbing system. Water moving through open, connected fractures carries heat with it, far faster than rock conducts it. The team expects that shortcut to open as heatwaves become more frequent, and to speed up the warming. That expectation is an inference from what they have measured, not something the record shows yet.
What is at stake is the rock itself. Ice in fractures helps hold steep alpine faces together, and its loss has been linked to rockfalls, debris flows and accelerating rock glaciers elsewhere in the Alps. The Zugspitze is not an empty mountain: a cable car runs to its summit, and the research station at the other end of the monitoring tunnel is a working laboratory. The authors see calibrated resistivity monitoring as one component of an early-warning system for mountain huts and cable-car stations, and they are just as clear about what it cannot do by itself. It has to be read with geological mapping and with borehole or tunnel access, and a calibration means little without at least one full freeze-thaw cycle measured at several depths. Their other recommendation is less glamorous and probably harder: keep the instruments, the settings and the procedures identical for decades, because that consistency is what turns a series of monthly readings into a reliable climate trend.
Sources
- The CryospherePeer-reviewed
- tc.copernicus.org