Spy Satellites, Survey Flights and the Svalbard Glaciers Nobody Was Watching

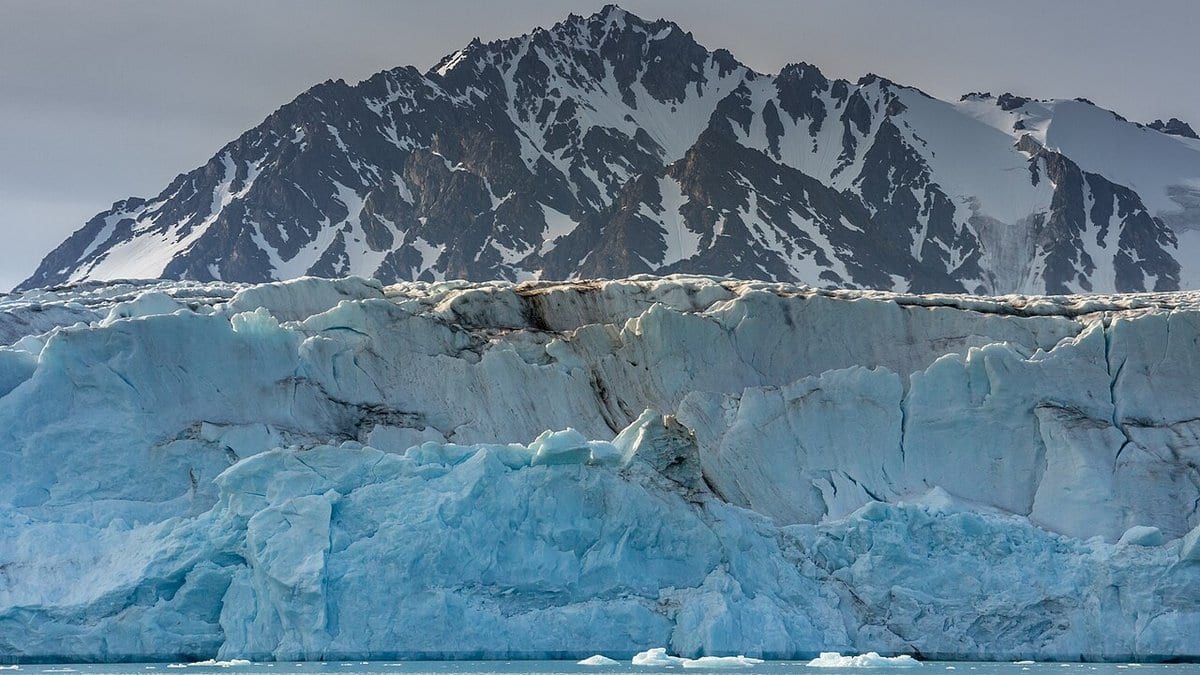
In the summers of 1936 and 1938, two Norwegian expeditions led by the geologist Adolf Hoel flew cameras over Svalbard and came home with 5,507 photographs. They were taken to make maps. Twenty-six years later, an American satellite passed over the same islands with a camera built for the same purpose, and its film stayed classified until the 1990s. Neither set of pictures was made to watch glaciers. Both are now the earliest archipelago-wide measurement of what Svalbard's tidewater glaciers were doing before anyone thought to look from orbit.
The gap that leaves is the reason for a paper published July 28 in The Cryosphere. Satellite monitoring of Svalbard's calving fronts is dense and reliable from the mid-1980s onward, roughly when the modern Landsat record begins. Before that, the record thins to individual glaciers and scattered field surveys. Loris Danjou, Eero Rinne and Erik Schytt Mannerfelt went into three archives and came out with calving-front positions for 171 tidewater glaciers, from 1936 to 1978. Danjou and Rinne are at the University Centre in Svalbard, Mannerfelt at the University of Oslo.
The three archives are worth naming precisely, because each brings something the others cannot. Hoel's aerial photographs, which another team reprocessed with modern photogrammetry in 2022 into an orthorectified mosaic and elevation model, provide the 1936 to 1938 baseline. The 1962 and 1963 imagery comes from KH-5 ARGON, part of the American KeyHole reconnaissance program that flew from 1959 to 1984 and left 1.66 million photographs, declassified in batches starting in the 1990s. The study used eight ARGON frames, from missions flown in May 1962 and August 1963, with a ground-projected pixel of about 30 meters on the digital copies. The third archive is Landsat MSS: 16 usable scenes from Landsat 2 and 3, flown between 1976 and 1978, at 60-meter pixels, free from the U.S. Geological Survey. The authors say theirs is the first study to use declassified intelligence satellite photographs over Svalbard.
The headline number: across those 171 glaciers, fronts retreated an average of 27.3 ± 3.0 meters per year between 1936 and 1978. Over 42 years, that is roughly a kilometer of retreat per glacier. The area lost from the fronts totaled 642 ± 167 square kilometers, a rate of 17.0 ± 2.5 square kilometers a year.
Putting that next to the present has to be done carefully, and the paper does it on area rather than on retreat rate. The 17.0 square kilometers a year lost between 1936 and 1978 sits below the 23.78 square kilometers a year that a separate group calculated for 1985 to 2023, working from a deep-learning analysis of 124,919 calving-front positions at 149 Svalbard glaciers. Same order of magnitude, somewhat higher now. That is a real acceleration and a modest one, and it is worth resisting the urge to make it sound like a cliff edge.
The temperature record over the same islands moves in the same direction. Reanalysis data quoted in the paper puts the 1940 to 1978 average at −6.42 degrees Celsius and the 1979 to 2023 average at −4.05, a warming of more than two degrees between the two windows the glacier numbers straddle.
Buried in the per-glacier results is a small piece of glaciological detective work. Svalbard has an unusual concentration of surge-type glaciers, ice masses that spend decades nearly still and then lurch forward for a few years. Surges are recorded when someone is watching. Between 1936 and 1978, mostly, nobody was. The study picks out 15 advance events across the archipelago, 13 of which it attributes to surges, and one of them had never been documented at all: Emmabreen advanced about 450 meters between 1936 and 1963. The authors' conclusion is blunt. Emmabreen, they write, "has surged twice in the last century; between 1936 and 1963, and in the 2010s." Two other surges whose timing had only been bracketed loosely are now pinned down: Stonebreen, which advanced 1,664 meters, to between 1936 and 1963, and Allfarvegen, which advanced 380 meters, to between 1976 and 1978.
At the other extreme sit two fronts that moved kilometers rather than meters over the period: Negribreen retreated roughly 7,300 meters, Nathorstbreen roughly 7,600. The spread between those and the glaciers that advanced is the point. An archipelago-wide average of 27.3 meters a year is an average over very different behaviors.
How reliable is a glacier front traced off a 1962 spy photograph? The authors put front-positioning accuracy at 60 to 140 meters, set mainly by image resolution, and they flag the 1962 and 1963 frames as the worst of it, because sea ice in the fjords can make the edge of a glacier hard to distinguish from the edge of the ice in front of it. The Landsat scenes had to be digitized by hand, because the automated front-detection methods now standard in glaciology rely on shortwave-infrared bands that the old MSS sensor did not carry. Fronts were converted to a single distance using an extrapolated centerline method and cross-checked against the more common box method; the two agree closely.
The whole thing is open. The Cryosphere publishes under EGU's open review, so the referee reports and the authors' replies sit on the public record next to the paper, and the article itself carries a CC BY license. The georeferenced images, the ground control points used to place them, the digitized calving fronts as shapefiles and the boxes and centerlines used to measure them are all deposited on Zenodo. Anyone who wants to disagree with a front position can go and look at the pixel.
What the paper adds is not a surprise about direction. Svalbard's glaciers were retreating in the 1930s and they are retreating now, and everyone expected that. What was missing was a number for the earlier stretch, measured the same way across the whole archipelago, so the modern rates have something to be compared against. Now there is one: 17.0 square kilometers a year then, close to 24 now, from photographs taken by people who were mapping coastline and, later, looking for something else entirely.
Sources
- The CryospherePeer-reviewed
- tc.copernicus.org
- EGUspherePreprint