What Opens the Cracks in Antarctic Sea Ice? A Machine Ranked the Culprits

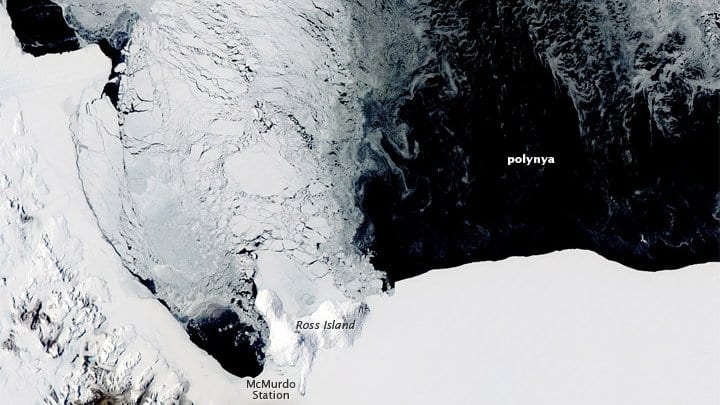
Picture the winter sea ice around Antarctica not as a solid lid but as a shifting, fracturing crust. Cracks tear it open: narrow lines called leads and larger stretches of open water near the coast called polynyas. Through those openings, ocean water that is near its freezing point still runs far warmer than the polar air above it, and heat pours upward. These gaps are a small fraction of the frozen surface, yet they carry an outsized share of the exchange of heat, moisture and gas between the Southern Ocean and the sky.
So what decides where the ice cracks open? Wind is the obvious suspect. Ice divergence, the ice being pulled apart, is another. Ocean currents underneath are a third. Researchers have long known all three matter. What they lacked was a way to say, across the whole continent and across many winters, how much each one actually contributes.
Umesh Dubey, Sascha Willmes and Günther Heinemann, of the environmental meteorology group at Trier University in Germany, went at the question with a random forest, a machine-learning method that learns patterns from data rather than being handed a set of physical equations. They trained it on April-through-September conditions from 2003 to 2023, pairing satellite-derived maps of where leads appeared with reanalysis fields for winds, currents and ice motion. Then they asked the model a diagnostic question: if you scramble one input at a time, how much worse do your predictions get? That "permutation importance" is a way of ranking which drivers the model actually leans on. Their paper, published on July 21 in the journal The Cryosphere, lays out the results.
Five variables did most of the work, together making up about 68% of the model's importance. Zonal wind, the east-west component, came first at roughly 18%. Ocean-current speed followed at about 14%, then overall wind speed near 13%, the north-south wind component at 12% and ice divergence at 11%. Winds, in other words, dominate the picture overall, which fits the long-standing intuition that the atmosphere shoves the ice around. But the currents are right behind the winds.
The sharper finding is about the coast. In the band of water within 50 kilometers of the shore, ocean-current speed becomes the dominant driver across the whole of Antarctica. There the model tracked the observed lead pattern closely, with a correlation of about 0.89. Across the full continent the fit was looser, near 0.70, and it varied by sector, running roughly 0.63 to 0.82. The nearshore result matches the physical picture of coastal polynyas, where currents and the geometry of the shoreline help hold water open against the freezing.
This analysis is a ranking of environmental drivers rather than the discovery of a new mechanism. While a random forest algorithm can identify key inputs, this statistical signal of association is not a proof of cause. The model does not fully reproduce the fine-scale structure seen in satellite observations, and a real share of the variance in where ice leads form remains unexplained. The impact of each driver largely depends on local conditions and coastal geometries: the ranking shifts from place to place, and continent-wide averages smooth over those differences.
Leads and polynyas are hard to represent in the climate and sea-ice models used to project the Southern Ocean's future, making it crucial to know which drivers carry the most weight. If coastal currents pry the ice open near the shore, a model that misrepresents those currents will misplace the open water and the heat exchange it governs. Ranking these drivers is not the same as fully explaining them, but it directs future modeling exactly where to look first.
Sources
- The CryospherePeer-reviewed