A Crack on Pine Island's Northern Ice Shelf Is Growing Twice as Fast

In a satellite picture taken on June 26, 2025, the crack is barely worth noticing: about 4.1 kilometers of dark line in the floating ice at the northern edge of Pine Island Glacier. Nine months later it runs 12.5 kilometers. Nobody was standing near it when it opened and nobody is likely to be. This is the quiet corner of the most closely watched glacier in West Antarctica, and nearly everything known about it has been read off satellites.
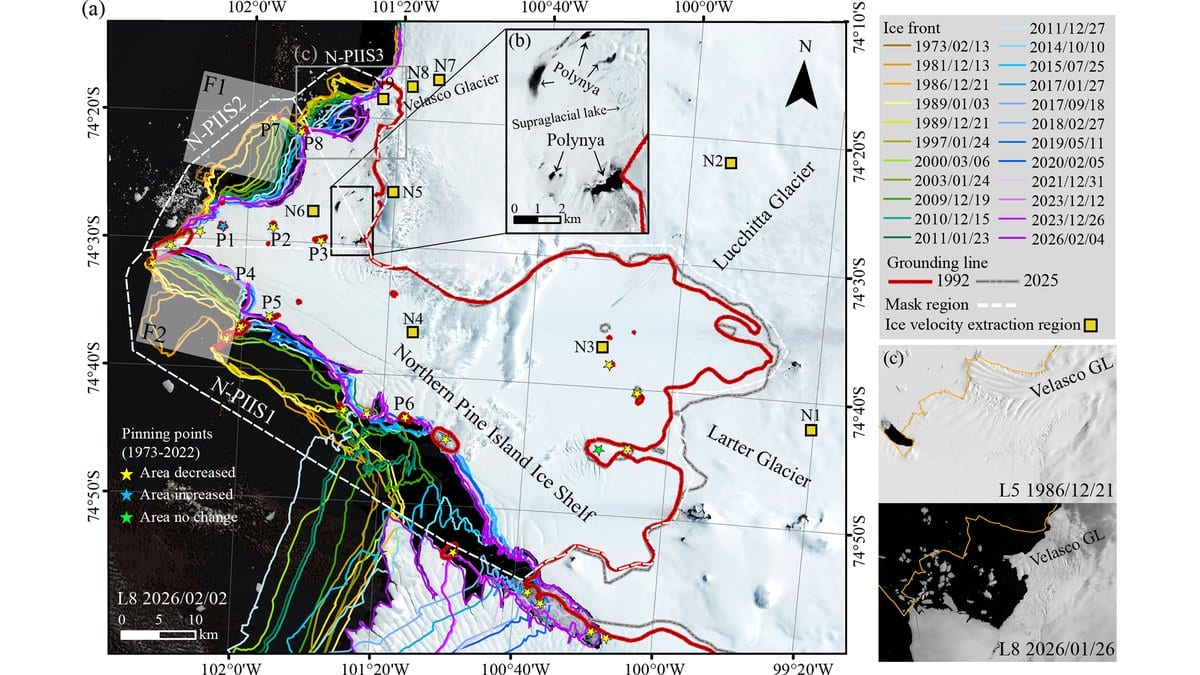
That reading is now a paper. Yite Chien, Chunxia Zhou and Baojun Zhang, of the Chinese Antarctic Center of Surveying and Mapping at Wuhan University, published their survey of the northern Pine Island Ice Shelf on Oct. 21, 2026, in The Cryosphere. They stacked Landsat pictures going back to 1973 against Sentinel radar, laser heights from NASA's ICESat-2, velocity maps and sea-ice records, and asked one question: is this sector going the way of the shelves that have already broken up?
Two cracks carry the story. The one in the June 2025 image opened north of a rise in the seabed sometime between June and August 2025. The other appeared in 2022 and has been measured each December since: it lengthened at roughly 4 kilometers a year through 2024. It then ran from 11.3 kilometers on Dec. 27, 2024, to 19.5 by Dec. 28, 2025, nearly twice the earlier rate. Both are new only within the satellite record. A crack was already present near another of the seabed rises in August 2017.
Where the shelf is losing its grip
Those seabed rises matter more than the cracks do. An ice shelf floats, but it also rests here and there on high points in the seabed, and each contact works as a brake on the ice behind it. This team tracked them two ways, and the two ways do not fully agree. In radar pairs that catch the ice flexing with the tide, covering 2017 to 2025, the point labeled P3 is no longer detectable after October 2022 and P4 is not detected at any time. P5 begins to disappear in December 2023, after the shelf broke up nearby. In the Landsat images, the same paper reports P3 still present in 2026 and P5 gone after 2007. The uncontested statement is the broader one: across this shelf, most of that seabed contact has been shrinking since 1973, according to a 2024 survey of pinning points across Antarctica that the new work builds on.
Thinning is an inference here, not a measurement; no thinning rate appears anywhere in the paper. What it has instead is that vanishing contact with the seabed, surface heights along a single ICESat-2 track, and polynyas, patches of open water that keep opening inside the shelf itself. Polynyas were not detectable in three Landsat images from 1986, 1989 and 1997, were clearly there from 2003 on, and expanded markedly in 2021 and 2026. Three images are a thin basis for an absence. Their formation may promote the shelf's disconnection from the ice sheet behind it. The surface heights, with an allowance for the airy old snow near the top, imply ice about 300 meters thick in the sheltered western sector and under 150 meters in the two sectors facing the open sea.
The sea ice goes first
Thin ice is where the breaking happens. The sea ice that freezes fast to the coast in winter damps the swell rolling in off the Amundsen Sea, and when it goes, the shelf front calves. That is the order of events at the Velasco Glacier in January 2022. Open water appeared inside the shelf in September 2021 and the fast ice broke apart through November and December; the glacier front calved during Jan. 14 to 17, 2022. It happened again between November 2025 and March 2026 at the two sectors facing the sea. Independent modeling published in 2025 finds that ocean swell bends shelves below that thickness hardest, which is why the hedge in the paper is that swell may contribute here, not that it does.
The ice is moving faster too, by less than it may first appear. At sites on the shelf and on the grounded ice behind it, the annual speed rose by about 50 to 100 meters a year between 2014 and 2026. That is the increase, not the speed; two sites that did not accelerate were running at 50 to 70 meters a year. At the Velasco Glacier the speed-up came after the shelf sector it leaned on shrank away from it in 2024, which the authors say may have contributed, although other factors may also have influenced the response. The same glacier calved in January 2022 with no clear speed-up afterward.
Fifty-three years in one direction
Area has only ever gone one way. The western sector lost about 600 square kilometers between 1973 and 2026, 200 of them in a single step between 2014 and 2015, when it came away from the central shelf. The two eastern sectors lost about 120 and about 40. The paper also gives each loss as a share of that sector's largest recorded area. As printed, those shares come out above 100%, which cannot hold under the definition the paper itself sets out. The square-kilometer figures are the ones that stand.
None of this is the Pine Island that usually makes the news. The central trunk is the fast, thick, heavily instrumented part of the glacier; this is the northern shelf, thinner and slower and far less watched, and the paper puts no sea-level number on any of it. The line where the ice first lifts off the bed has stayed relatively stable at its feeder glaciers, the Lucchitta and the Larter.
The authors state plainly that large-scale collapse has not yet occurred, and ask for measurements made on the ice itself and modeling before anyone says where this ends. What they describe is a shelf that may be undergoing changes that could reduce its stability, set against a sequence that has run to its end elsewhere: thinning, loss of grip on the seabed, sea-ice loss and then rifting preceded the collapse of East Antarctica's Conger-Glenzer Ice Shelf. Their shape files, elevation extracts and plotting code are on Zenodo, and every satellite archive behind the study is public, so the next decade of images can be checked against the same record.