Wyoming's Snow Monitors All Sit in the Forest. The Water Is in the Drifts

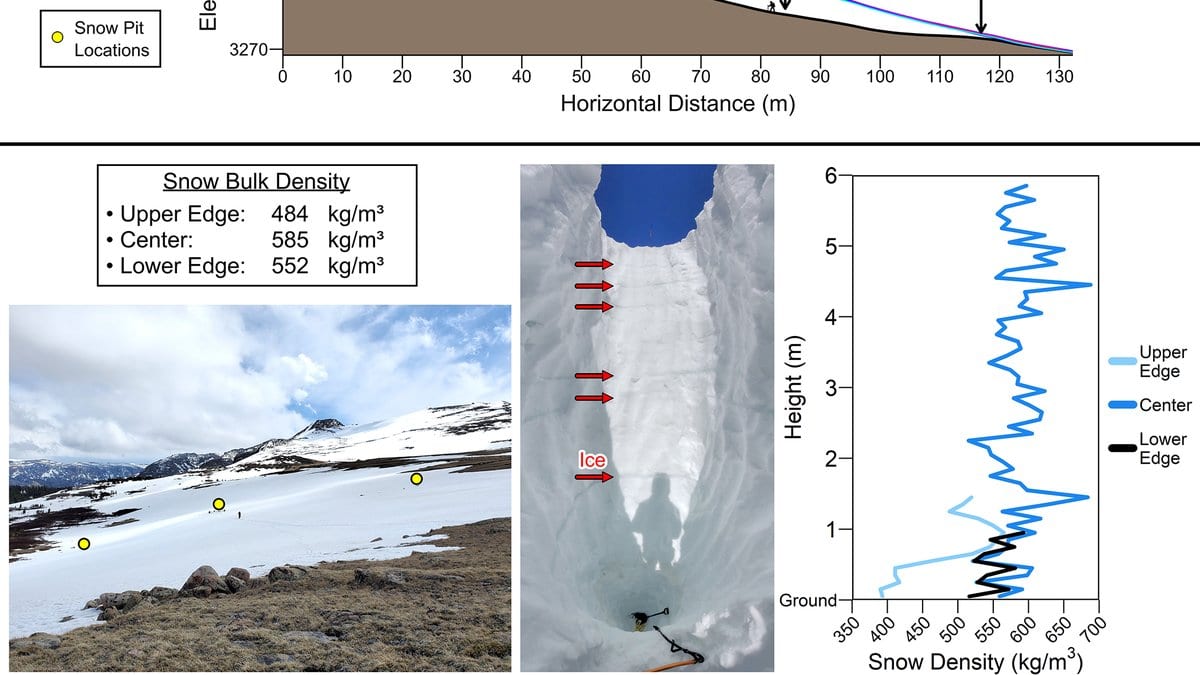
In the last week of May 2025, six people spent the better part of a day digging a hole in the snow in Wyoming's Wind River Range. Federal wilderness rules bar power tools, so the pit went down by shovel, 5.9 meters from the wind-scoured surface to the rock underneath. Measurements did not begin until the second day.
What came out of that pit wall is why the day was worth spending. The snow in the drift averaged 585 kilograms per cubic meter, closer to glacier firn than to anything most people picture when they picture snow. The standard empirical models hydrologists use to convert snow depth into water sat 14% to 35% below that. In forest a short walk away, sampled the same week, bulk densities ran as low as 339 kilograms per cubic meter.
That contrast is the subject of a paper in The Cryosphere by Elijah Boardman of Mountain Hydrology in Reno, Adrian Harpold of the University of Nevada, Reno, and colleagues, who dug 78 full-depth density profiles in all, across several spring seasons of fieldwork. They chose the sites deliberately rather than at random — deep drifts, steep slopes, avalanche runouts, high alpine ground — so the sample is a catalogue of the settings a snow survey normally skips, not a portrait of the average snowpack.
The reason those numbers did not already exist is mostly logistical. Vertical density profiles are usually measured over the top meter or two of a snowpack, even where the snow runs much deeper, because going further in a remote basin costs a day nobody has budgeted. The authors point to one of the best-funded snow surveys recently run in the western United States, where the deepest pit reached 1.43 meters. Digging past that means carrying shovels on foot into a wilderness where machines are not allowed, over three separate trips across the range.
Wind does two things to a drift at once. It piles the snow deeper, and, by fracturing the grains as it drives them along, it packs what lands into something hard. The first effect is now mapped well: airborne lidar surveys give snow depth across entire mountain ranges at a resolution of a few meters, which is why depth has become the easy half of the problem. The second is invisible to lidar, which measures depth and not density. The paper's stated starting point is that the contribution of wind-packing to how unevenly water is distributed in a snowpack remains unknown.
That leads back to where density numbers come from in the first place. Wyoming has 88 automated daily snow monitoring sites, the SNOTEL network that western water forecasting leans on, and every one of them sits in relatively low-elevation forested ground. That is not carelessness. It is what makes a site reachable in February and safe to service, and a forest clearing is a sensible place to measure snowfall. It also means alpine wind drifts are structurally excluded from the observational record. A drift is not a slightly denser version of forest snow, as the two densities measured in the same week make plain.
The scaling step sharpens the point. The team fitted a statistical model of snow density to their pits, weighting each pit by how much of the lidar-surveyed snowpack it actually resembles, then extended it across whole watersheds. On that measure, the most representative density measurements in the entire dataset were the alpine drifts deeper than two meters. The hardest ground to reach, and the least often sampled, describes the range's water better than anything else they dug.
In its final section, the paper sets three widely used near-real-time gridded products, the kind of dataset a water manager opens in spring to see how the season is shaping up, against the lidar-based map at matching scales. At the 500-meter grid scale, the products understate the standard deviation of snow water equivalent across the range by 33% to 75%: the snowpack they show is far more evenly spread than the one that is there. In a single 1-square-kilometer glacial cirque basin, the sort of drifted bowl that holds snow well into summer, they understate the water by 65% to 73%.
Averaged across the whole landscape, the same products come within 2% to 17% of the lidar-based mean. The landscape mean survives the missing drifts considerably better than any individual place does, but the upper end of that range is not a rounding error on a water year, and being broadly right about a total is a different thing from being right about where the water is.
Where it is governs when it arrives, because a deep drift melts out long after the shallow snow around it. A basin-scale forecast built on one of these products is working from a different snowpack than the one that will actually melt out of a drifted cirque, even where the seasonal total looks about right.
Sources
- The CryospherePeer-reviewed