Warming Is Speeding up, but the Date It Became Visible Depends on the Record

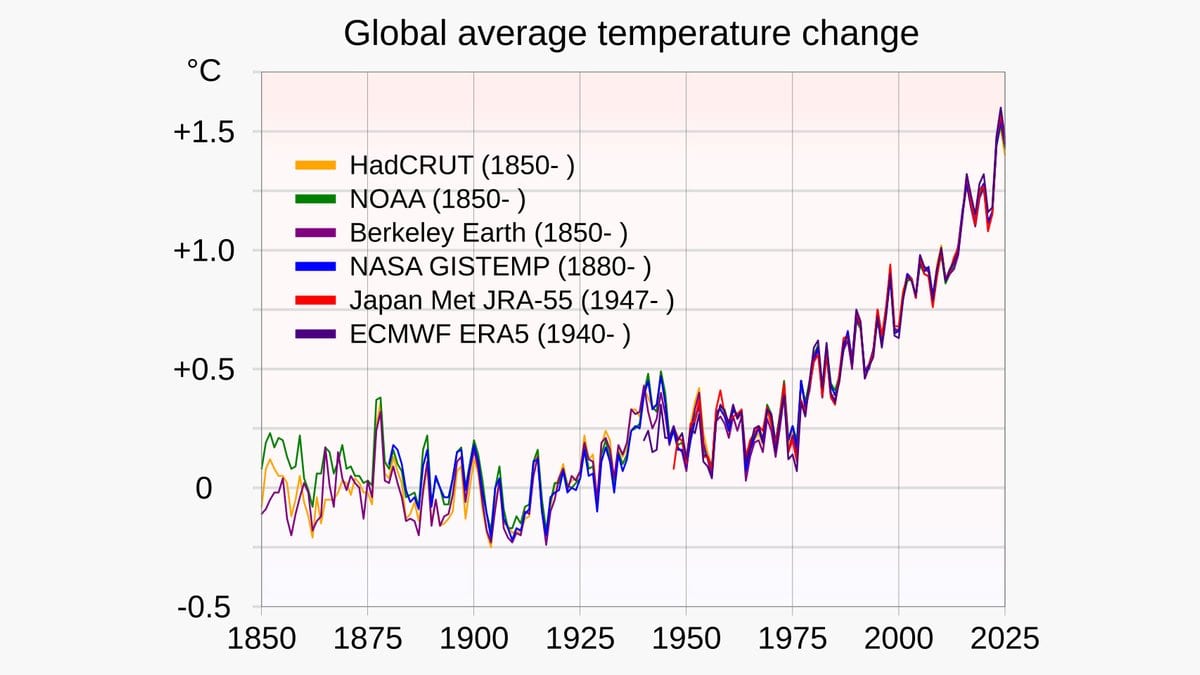
Not whether the planet is warming, but whether the warming itself has sped up: that narrower question has had two confident and opposite answers in the space of two years, from different teams reading the same global temperature records. Nothing about the planet changed in between. What changed was the test.
In October 2024, Claudie Beaulieu and colleagues published a study in Communications Earth & Environment that put long temperature records through changepoint models, which hunt for abrupt shifts. They found limited evidence for a warming surge, and estimated that the trend would have to increase by at least 55% before a surge could be detected at all.
Then, on March 6, 2026, G. Foster and S. Rahmstorf, the second of them at the Potsdam Institute for Climate Impact Research in Germany, reported the opposite in Geophysical Research Letters. After they removed the estimated influence of El Niño, volcanic eruptions and solar variation, the quieter data that remained showed acceleration with better than 98% confidence, and faster warming in the last decade and more than in any earlier one.
A paper published on Oct. 16, 2026, in Environmental Research Letters argues that part of that disagreement belongs to the instrument rather than to the climate. Its author, J. Eduardo Vera-Valdés, works alone, and he is an econometrician at Aalborg University in Denmark rather than a researcher at a climate center. His target is the structural break test, the standard way of asking whether a trend has changed, which works by looking for a date where the slope jumps. If warming is instead accelerating smoothly, with no jump anywhere, Vera-Valdés shows that such a test cannot reliably date when the speedup began. It is built to find a kind of change that did not happen.
So he tests for curvature directly. In each of his specifications the thing being ruled out is exactly a constant warming rate, and the alternative on offer is a bend rather than a break. One of them is a linearithmic trend, a very gentle bend: it rises faster than a straight line, but more slowly than a squared one. Another lets the data set the shape of the bend themselves. Alongside both he reports the quadratic trend, a simple squared curve, which the recent literature has used.
From 1970 to 2025, tested once across the whole record, two of the three shapes come out clearly. Vera-Valdés finds the linearithmic and quadratic coefficients both positive and statistically significant in all five of the major temperature datasets, once El Niño and solar variability are controlled for. The five are the records kept by NOAA, NASA's GISTEMP, the ERA5 reanalysis from the European Centre for Medium-Range Weather Forecasts, the Met Office's HadCRUT and Berkeley Earth. Those two natural influences are controls here rather than findings, taken out so that whatever curve is left belongs to the trend.
Dating the onset is where the single answer breaks apart. Vera-Valdés re-estimates the trend over expanding windows of data, with a correction for the fact that testing many overlapping windows will eventually throw up a false positive on its own. Under the linearithmic specification, and under that one alone, acceleration first becomes detectable in data ending in mid-2023 for NOAA, in late 2023 for GISTEMP and in mid-2024 for ERA5. In HadCRUT and in Berkeley Earth it is not yet detectable. Those are the ends of the data windows, the vintage of record at which the test first succeeds, and not the years in which the warming began to bend.
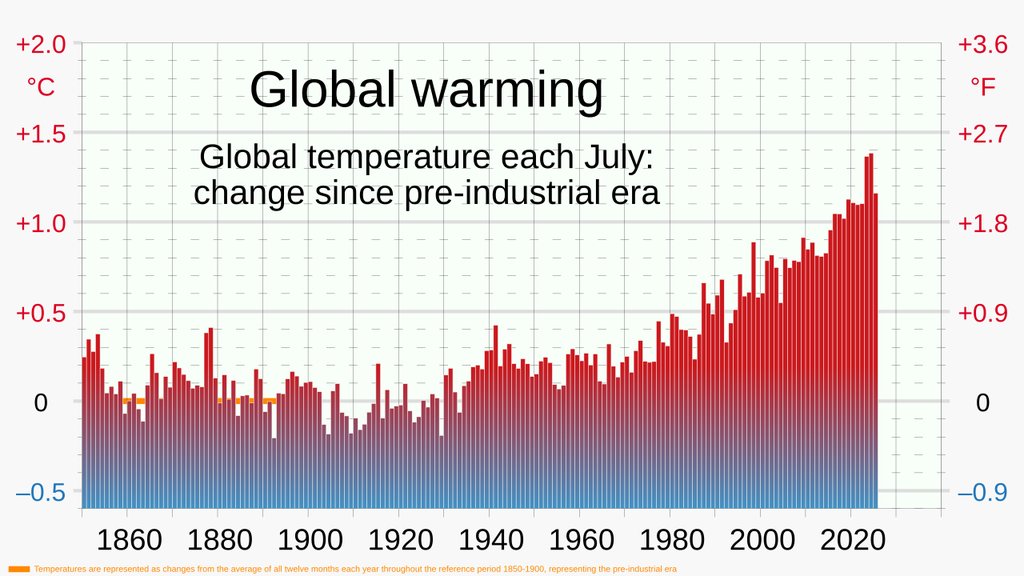
The freely estimated shape agrees on direction but reaches significance in fewer of the datasets, because working out the shape of a bend costs precision that testing a fixed one does not. The choice of shape also reaches past detection. The linearithmic trend implies the least curvature of the three, with an acceleration that declines over time, which makes it the shape that projects the least warming when extended to 2050. The gentlest curve that still counts as acceleration is also the most forgiving forecast.
None of this is a statement about cause. The paper asks whether acceleration can be detected and since when, not what is driving it. Nor does it overturn the two answers it opens with: Vera-Valdés reports the literature's quadratic trend beside his own and finds it significant in all five datasets, which agrees with Foster and Rahmstorf about the direction of travel. The quarrel is narrower, and it is about one instrument. A break test can establish that something shifted, and it cannot say when a continuous bend began.
The paper is peer-reviewed, and the version posted on Oct. 16, 2026, is an accepted manuscript under an open license, so the final text may still change at proofing. What it leaves behind is a more awkward answer to a public question, and a more honest one. Has global warming accelerated? Most of the main records now say yes. Since when? Three dates, two not-yets, and a curve that had to be chosen before any of them could be counted.