Mapping Glacier Change in the Gaps Between Satellite Tracks

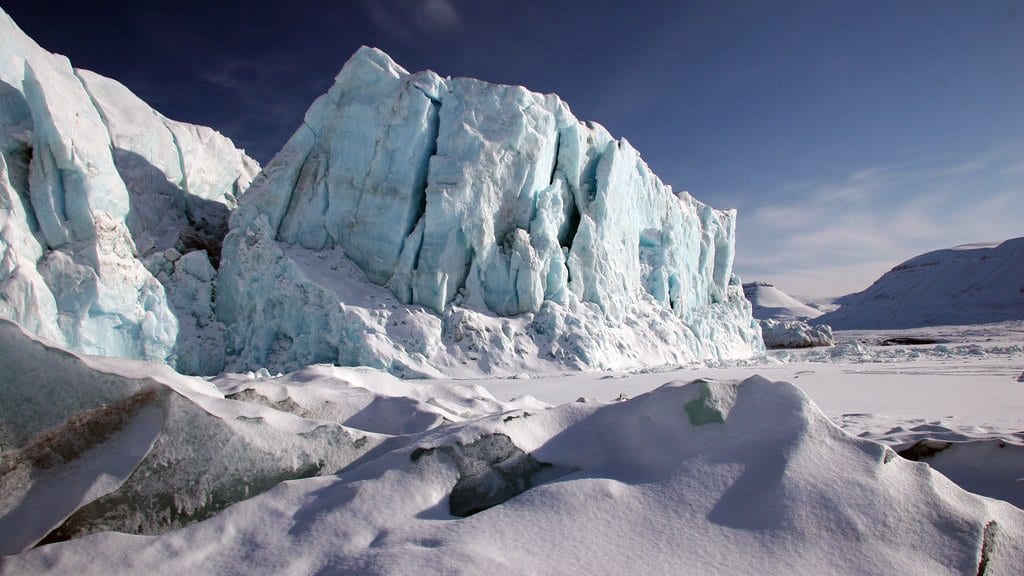
ICESat-2 does not photograph ice. It fires a laser at it along six narrow lines that retrace the same ground tracks, and between those lines it measures nothing at all. The beam pairs run about 3.3 kilometers apart. Plenty of glaciers in central Svalbard are narrower than that, and the ones that are wider often change fastest in the strip the satellite missed.
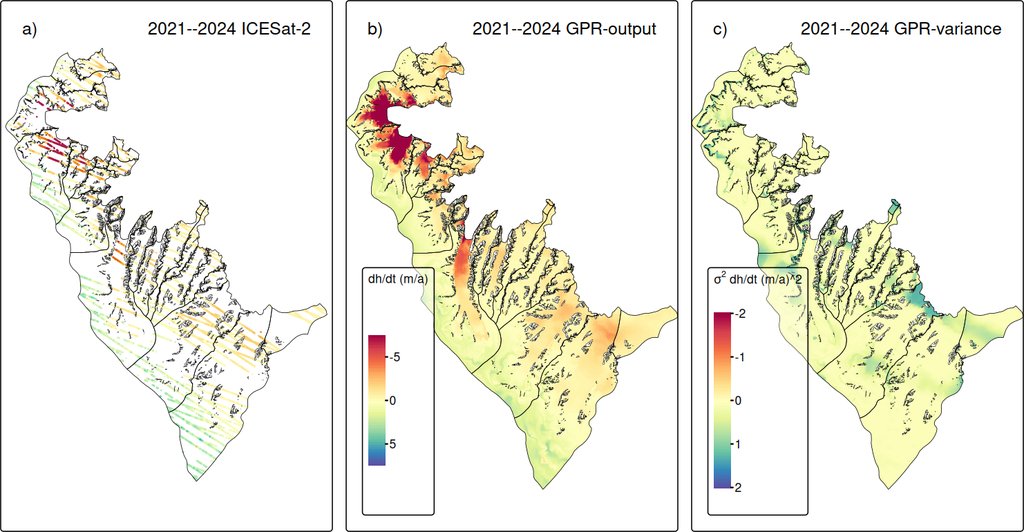
A paper published Oct. 26, 2026, in The Cryosphere is about that strip. Thorsten Seehaus of Friedrich-Alexander-Universität Erlangen-Nürnberg, with Alex S. Gardner and Johan Nilsson of NASA's Jet Propulsion Laboratory, fills the gaps between the tracks statistically. What comes out is a continuous map of how fast the ice surface is falling or rising, on a 200-meter grid, with an uncertainty attached to every point. It is not a fresh measurement of how fast the ice is going. It is a new way of reading measurements that already exist.
The method is Gaussian process regression, a statistical interpolation that hands back a prediction and a confidence together. It is a cousin of kriging, long the standard way to interpolate scattered ground measurements, generalized to take more than position as input. Here it takes two things: the surface height at each point, and which glacier the point belongs to. Nothing in it is a neural network, and nothing was trained on imagery.
The glacier label is the part that earns its keep. While Arnesenbreen was surging, its lower reach was thickening fast. Run the interpolation without the label and that thickening leaks across mountain ridges onto two neighboring glaciers where no laser track ran close by, glaciers that are dynamically independent of it. Adding the label removed most of that, and it does not remove all of it: a surge at Kvalbreen still pushes an apparent slight thickening across a fjord.
A different satellite, checking the same ice
Over the Larsen-B embayment on the Antarctic Peninsula, where the tributary glaciers have been thinning since the ice shelf in front of them broke up in 2002, the reconstructed field gives an average lowering of 0.61 ± 0.02 meters a year and a volume loss of 4.55 ± 0.17 cubic kilometers a year. That window is labeled 2021–2024 to match a second dataset, though the laser pairs behind it start in December 2020.
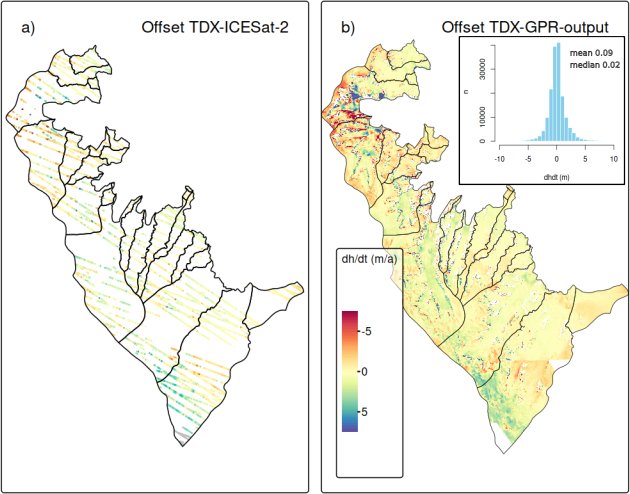
The second dataset is the check, and it is radar. The team processed TanDEM-X acquisitions from two Antarctic winters into its own height-change field over nearly all of the same area, and that field gives a larger loss: 0.72 ± 0.01 meters a year, and 5.26 ± 0.07 cubic kilometers a year. The authors put the mean difference at about 13 to 15%, blame part of it on the radar signal sinking into dry upper snow, and write that the good agreement validates their approach. That is a statement about the interpolation and not about the ice. It is also their own radar against their own laser: a second sensor, not a second team.
In Svalbard, the surges were already known
The Svalbard half of the study covers one block of the archipelago's central south, and the scope of that block matters more than any other detail in the paper. Across it, between March 2019 and December 2024, the maps give widespread thinning of 1.62 ± 0.03 meters a year. That is about twice the rate an earlier ICESat-2 survey reported for the whole of Southern Svalbard, and the reason is the scope: every glacier surge detected in Southern Svalbard by Mannerfelt and colleagues sits inside this study region, and a surge moves ice down to lower, warmer ground where it melts faster. The number describes the study domain, not the archipelago.
Those surges are where the paper proves its worth, and the maps did not find them. Ten surge-type glaciers inside the site had already been identified by two groups reading coherence in Sentinel-1 radar images. One is Mannerfelt, Schellenberger and Kääb; the other, working independently, is Guillet and colleagues. What the height-change fields add is timing.
At Scheelebreen, Vallåkrabreen, Nordsysselbreen, Doktorbreen and Paulabreen, the annual maps show ice starting to move before the dates the radar method assigns to the onset of the surge. The two methods define the beginning of a surge differently, and the authors say that accounts for part of the gap. The maps also tell the two kinds of surge apart: a bulge traveling down-glacier from the upper basin, and a wave of lowering that starts at the terminus and works its way up. And at Edvardbreen, where the radar study expected a surge to be starting, the field for 2023–2024 shows nothing.
Where the filled-in map gets thin
The paper is explicit about where to stop trusting the fill. The team cut circular holes of growing size into the input and asked the model to predict what it could no longer see. The errors grow with the size of the hole, with the steepness of the ground, and with distance from the nearest real measurement. In Svalbard, where glacier behavior changes over short distances, the spread of those errors widens steadily as the holes get bigger. The smoothing scale built into the model is about 10 kilometers, which is wide next to many of the glaciers it is being asked to resolve.
That is the honest limit, and it still leaves the method ahead of what is on the shelf. NASA publishes its own gridded height-change product from the same satellite, and over these two regions it resolves the broad pattern but misses the narrow, steep outlets and flattens the strongest signals. It recovers less than three quarters of the Larsen-B volume loss the interpolated fields give.
The input is public: the ICESat-2 height time series the study runs on sits at NASA's National Snow and Ice Data Center. The interpolation code and the finished grids are available from the corresponding author on request, which is the practical limit on anyone rebuilding this for another mountain range. The paper is peer-reviewed and open access. The authors close on a use for it: glacier surges have caused floods in High Mountain Asia, and seeing one begin a year earlier is worth something to the people who have to warn about them.