The Weather of 1903, Replayed in a Warmer World

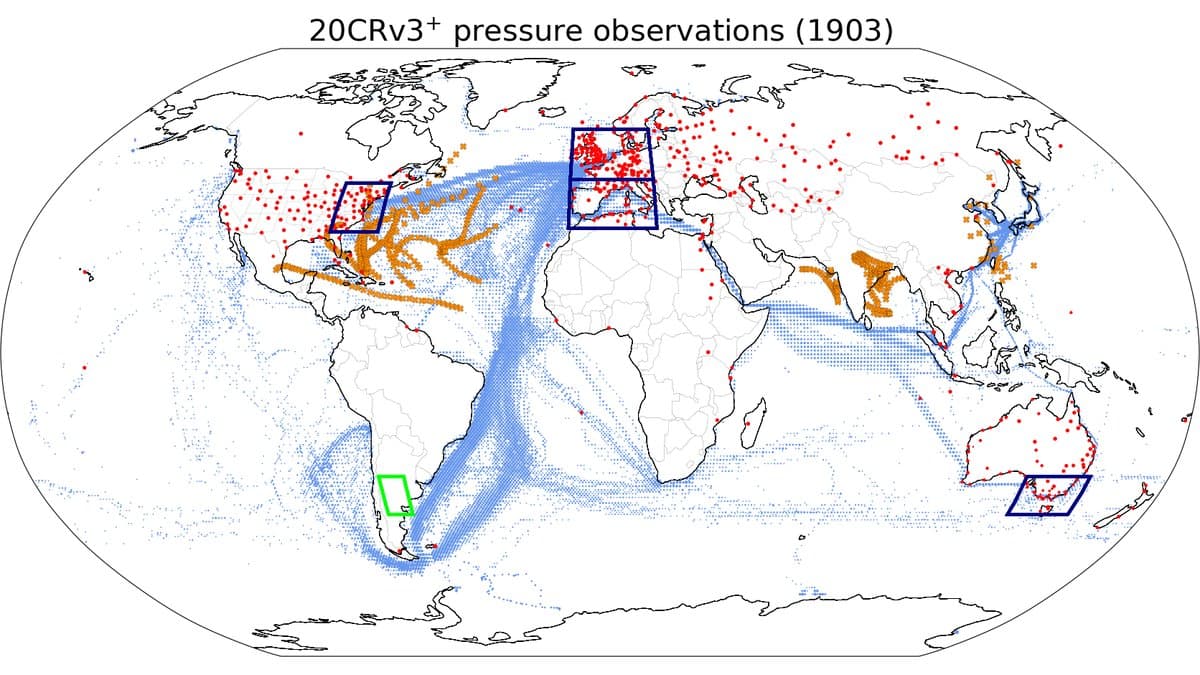
In 1903 the officer of the watch on a merchant ship read the barometer, wrote the number in the log, and thought no more about it. More than a century later that number, and hundreds of thousands like it from ships and weather stations, is the input to a climate experiment: the whole of that year, reconstructed hour by hour, and then run a second time over an ocean 2 °C warmer.
The experiment, published Sept. 25 in Earth System Dynamics by Rhidian Thomas, Ed Hawkins and colleagues at the National Centre for Atmospheric Science and the University of Reading, is about ordinary weather rather than disaster. Most attribution work asks what climate change did to a particular flood or heatwave. This one asks what it does to an unremarkable day.
The tool at the center of it is a reanalysis, a weather model steered by past observations. This one, 20CRv3, is steered by remarkably little. No temperature readings go in, no rain gauges, no wind. The only measurements it takes are of air pressure at the surface, from land stations, ships and tropical cyclone records, and from those alone it reconstructs where the highs and lows sat, every three hours, across the whole planet.
That thinness is what makes the comparison work. Feed the same pressure readings into a second run in which the ocean is 2 °C warmer and the air holds more carbon dioxide, and the same weather systems travel through on the same days. What is left between the two runs is the work of the extra heat and moisture themselves.
The authors are careful about how far that goes, and in the paper the word "same" appears inside their own quotation marks. Pressure readings hold the weather systems at the surface in place. They do not hold everything above: the paper notes that vertical motion and cloud keep some freedom to change, which is why the rainfall answer comes out less solid than the temperature one. Real warming also shifts where the storm tracks run, and this experiment leaves that out on purpose. Thomas and colleagues call their design a strongly conditioned form of attribution. It says what the same weather patterns would deliver in a warmer world, not which patterns a warmer world would bring. Two anonymous referees pressed on that point during the journal's open review, and the last sentence of the abstract was changed to spell it out.
The two ends of the thermometer move the most
In the four regions where 1903 left enough barometer readings to hold the model steady (northwestern Europe, the western Mediterranean, the US East Coast and southeastern Australia), 99% of days came out warmer. On an ordinary day the gain was 2 to 2.5 °C. At the ends of the range it was much larger.
Days that had been below freezing warmed by 4 to 5 °C, and that happened in three of the four regions: northwestern Europe, the western Mediterranean and the US East Coast. Southeastern Australia is the exception for an unexciting reason, which is that it barely freezes. The model's surface energy budget shows where the extra warmth comes from. On cold days there is less snow lying, so less sunlight is bounced back and more of it is absorbed by dark ground, which warms the air above.
At the hot end the effect is smaller, and the three regions are a different three. Days above roughly 20 °C warmed by 2.5 to 3 °C in the western Mediterranean, the US East Coast and southeastern Australia, but not in northwestern Europe. The reasons vary by place. On the hottest US East Coast days the soil is dry, so the ground can no longer cool itself by evaporating water; in southeastern Australia the difference looks like less cloud and more sun.
Rain changes shape more than it changes amount
The firmest rainfall result is about variability rather than totals. In all four regions daily rainfall swings more widely from one day to the next, including in the western Mediterranean, where the annual total falls. Rain arrives in fewer and bigger deliveries.
Beneath that is a redistribution. Days of heavy rain become more common, and the heavier the rate, the larger the increase. Days of light and moderate rain become slightly less common. And the extra rainfall all arrives on less than one day in ten: most wet days in the warmer runs are drier than their originals, not wetter. The drop in light rain is the one result the authors hold at arm's length, because models have long had trouble simulating drizzle and the paper says that limits confidence in this particular finding.
Carbon dioxide does something of its own
Two of the three runs already existed, from the same group's earlier work. The new one adds the carbon dioxide on top of the warmer ocean, and setting it beside the ocean-only run isolates what the gas does by itself. Over land away from the tropics it adds warmth that a warmer sea does not supply: across the Western US the direct effect accounts for 19% of the total warming. It also holds rainfall down in every season.
The paper also revisits October 1903, which remains the wettest calendar month in the UK record. Run again in the warmer world, the same October delivered 12% to 17% more rain across the UK and Ireland.
The idealizations are stated plainly, and they bound all of it: the ocean is warmed by a uniform 2 °C everywhere, sea ice is left exactly as it was, and the authors write that these conditions do not reflect observed or projected patterns of change. It is also a single year, and an unusual one. 1903 was globally cold, in the wake of the Santa Maria eruption in Guatemala the year before. What the approach offers is a cheap and repeatable way to put the question to any year for which enough barometer readings survive, and the team says further runs are coming with more realistic ocean warming patterns and with modern years, where the observations are far thicker on the ground.
Sources
- Earth System DynamicsPeer-reviewed
- esd.copernicus.org