Austria Counted Its Glaciers Again and 95 Were Missing

A glacier can leave the map before it leaves the mountain. Under the loose rock at the head of a valley there may still be ice. But nobody can trace a line around it anymore, so no line gets drawn.
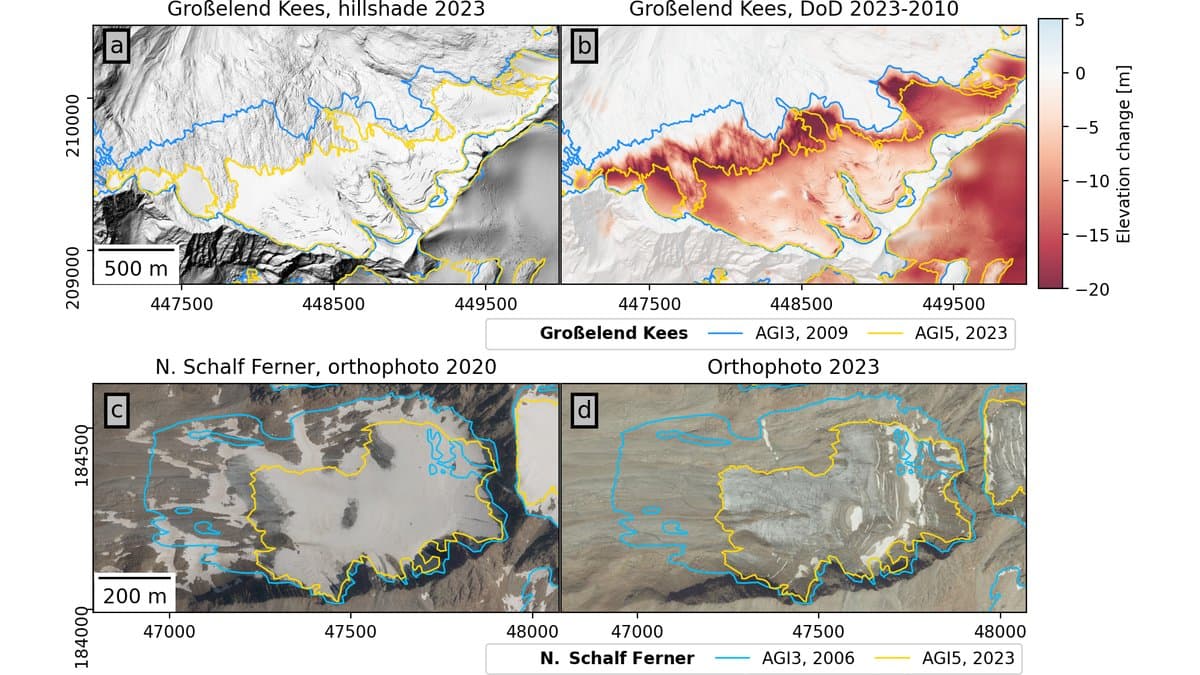
That is part of what happened to 95 of Austria's glaciers. The fifth Austrian Glacier Inventory was published in The Cryosphere on Sept. 14. It redraws the country's ice from aerial photographs and aircraft laser scans taken between 2021 and 2023, whichever year gave each region usable coverage. A national ice map is not kept for its own sake. The outlines go into river flow forecasts and into hazard assessments for the valleys below. They also go into hiking maps and into the models that project how much ice the country has left. Lea Hartl of the Austrian Academy of Sciences in Innsbruck led the work, with 28 colleagues from universities, provincial survey offices and the national weather and geology agency.
The third national inventory, drawn from imagery flown between 2004 and 2012, mapped just over 400 square kilometers of ice. The new one maps 285. The difference is 31% of what that earlier survey recorded, occurring over a span of about 15 years. A fourth inventory exists, for 2015 and 2016, but it used different methods, so the comparison runs back to the third.
The 95 missing glaciers are the part of that arithmetic most likely to be misread. Some are simply gone, with no evidence of ice left inside the old outline. The rest may still hold ice under rock, snow or shadow that no photograph sees through, and the mappers would not draw a boundary they could not defend. Both kinds drop out of the inventory, and the dataset keeps the two categories apart. Together they account for less than 3% of the area Austria lost, because the glaciers that go first are the small ones.
And small is what most Austrian glaciers now are. Almost nine in ten are under half a square kilometer, and together they hold about a fifth of the country's ice. Nine large glaciers hold more than a quarter of it. The loss rates follow the same split. In the regions that still carry a lot of ice, the typical glacier gave up 2% to 3% of its area a year. In regions made up mostly of small ones, the figure approaches 7%. Rates ease as glaciers get bigger. The authors tie the pattern to a feature of very small glaciers: many no longer keep a lasting snowfield at the top, so what melts in summer is not replaced.
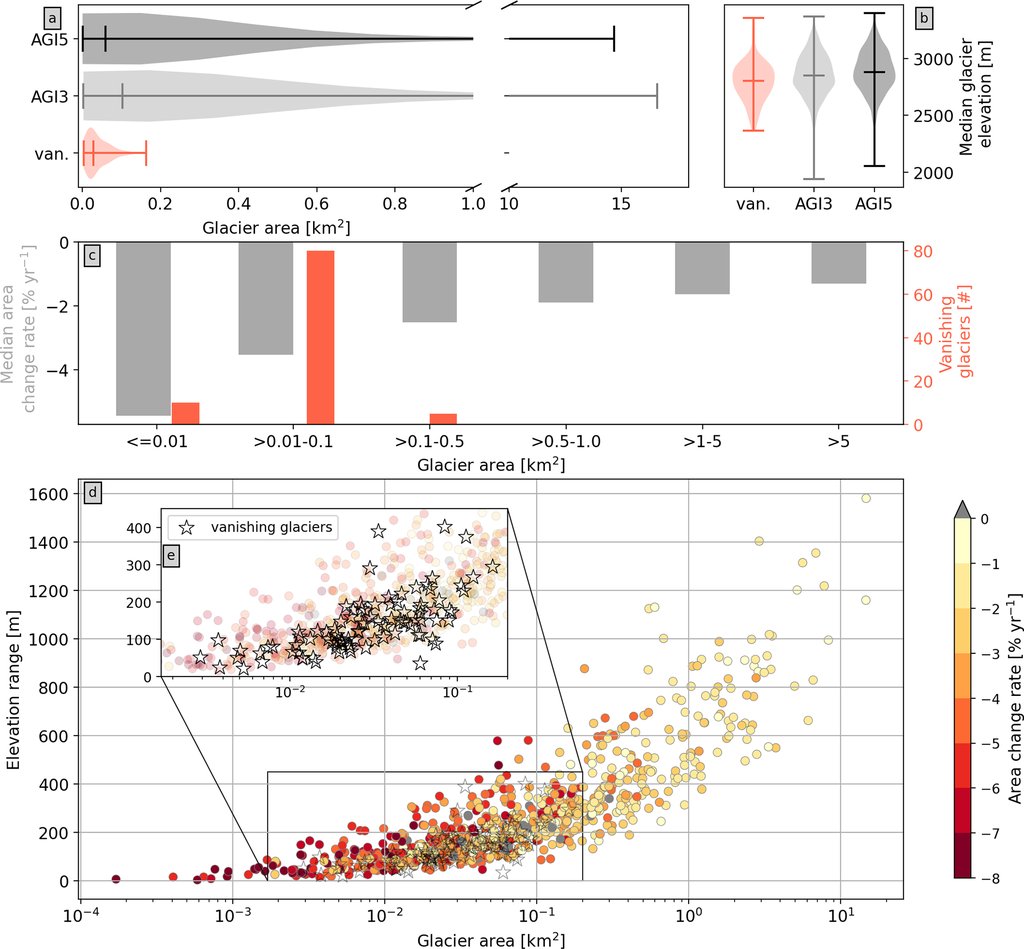
Nor is the loss confined to the low tongues. Almost a quarter of it came from above 3,000 meters, which the researchers interpret as a sign that ground once reliable for gathering snow is now in retreat itself.
The measurement is hand work. Analysts traced every outline on screen over aerial photographs sharp enough to show detail 10 to 25 centimeters across, with ground-height maps from aircraft laser scans open beside them. Ice buried under rock is the hard case, and the team put a number on how hard. Fifteen analysts mapped the same six glaciers separately. Where a margin was clean ice, their lines landed within a couple of meters of one another. Where it ran under rubble, they spread. On the smallest of the six, 14 of the 15 judged the glacier effectively gone and one did not.
About a third of the glaciers in the new inventory carry an outline its mapper flagged as uncertain, nearly always because of rock cover, and those glaciers hold only a small share of the ice. The authors also expect that rock-covered ice is undercounted, in this inventory and in others built the same way. That would put the true area a little higher than the figure they publish.
Austria has been counting this way since the late 1960s, which is what lets the new numbers be read as a trend rather than a snapshot. From the first inventory to the second, in the late 1990s, the typical glacier lost about 1% of its area a year. Between the second and the third, 1.6%. Between the third and this one, 3.4%. The number of glaciers dropping off the map went from five to 11, and then to 95.
That last step is the argument the study ends on. Austria has redrawn its inventory about once a decade, and at the rates now being measured the team notes that a decade is too long a wait. The people who use these outlines model how much water comes off the slopes, plan for hazards below the ice or need to know how much ice one valley still holds. The researchers call for updates more often, for inventories that reach across national borders and for more of the tracing to be done automatically, with people calibrating and checking the result.
The paper came through The Cryosphere's open review, with the referees' reports and the authors' replies posted beside it. The outlines are free to download and reuse, region by region, from the PANGAEA repository, alongside a separate file containing coordinates for the glaciers that have disappeared.