How Fast Radio Bursts Help Us Explore the Structure of the Universe

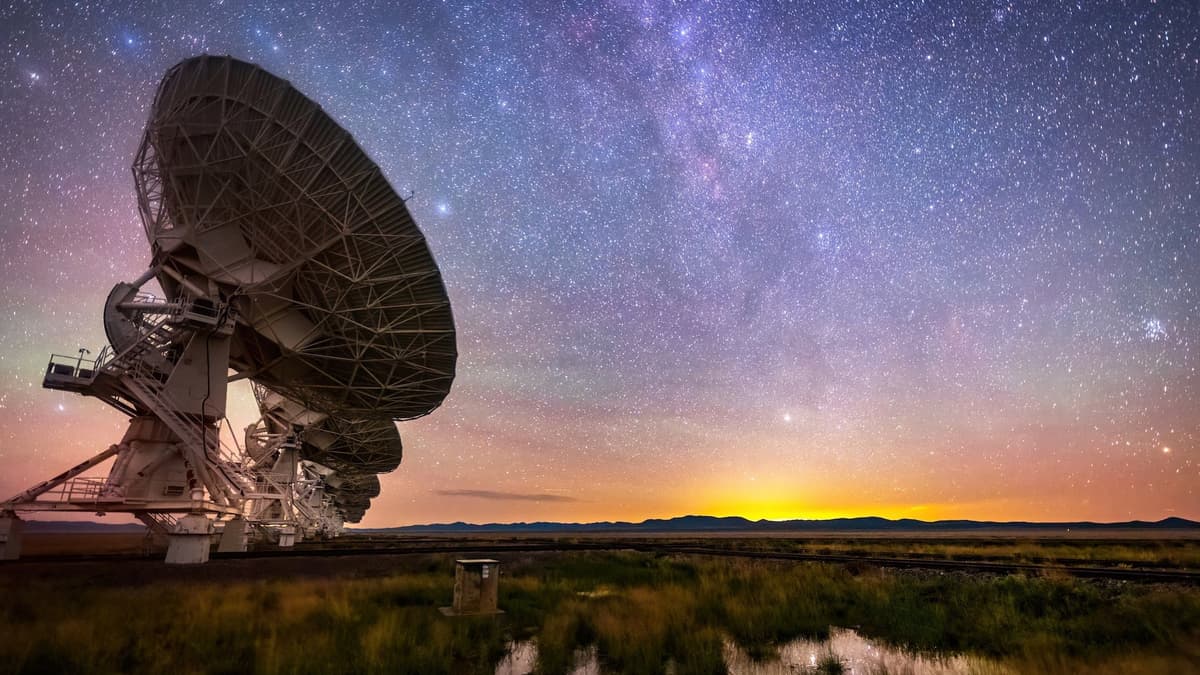
A radio burst from a distant galaxy can help us understand the structure of the Universe. How? On its way to Earth, the signal passes through diffuse gas that is difficult to detect through its own emission. Free electrons in this gas delay the low-frequency portion of the radio burst’s signal more than the high-frequency portion. By comparing these delays across many bursts with model calculations, astronomers can infer how gas is distributed throughout the Universe. In a study titled “Signatures of suppressed matter clustering revealed by fast radio bursts,” published on September 8, 2026, in Nature Astronomy, astrophysicist and California Institute of Technology doctoral student Kritti Sharma and her colleagues used 114 such fast radio bursts (FRBs) to investigate how gas is distributed around galaxies and galaxy groups.
Why does this knowledge matter for cosmology? Because cosmologists use the distribution of matter in the Universe to test how accurately they understand dark matter and dark energy, both of which influence the formation and growth of cosmic structures. Yet the distribution of matter in the Universe is shaped not only by these invisible components but also by the movement of ordinary gas: stellar explosions and active galactic nuclei can expel gas from galaxies into the surrounding space. Scientists need to quantify how gas redistribution changes the clustering of matter so they can better assess the effects of dark matter and dark energy on cosmic structure. Studying radio bursts helps refine this estimate, making cosmological calculations more reliable.
What draws me to this study is the way the inquiry is framed: researchers use fast radio bursts, a phenomenon whose origin is still not fully understood, to study the distribution of ordinary gas and its influence on the inhomogeneity of matter throughout the Universe. One cosmic mystery, it turns out, offers a way to approach another.
What the Cosmic Web Reveals
What exactly do cosmologists see in the distribution of matter, and how do they extract information about the history of the Universe from it? Galaxies gather into groups and clusters, forming long filaments separated by enormous underdense regions. This structure is known as the cosmic web. For cosmologists, what matters is not only the arrangement of its filaments and nodes but also how much the density of matter varies across different spatial scales. These variations allow them to trace how gravity assembled matter into structures over billions of years.
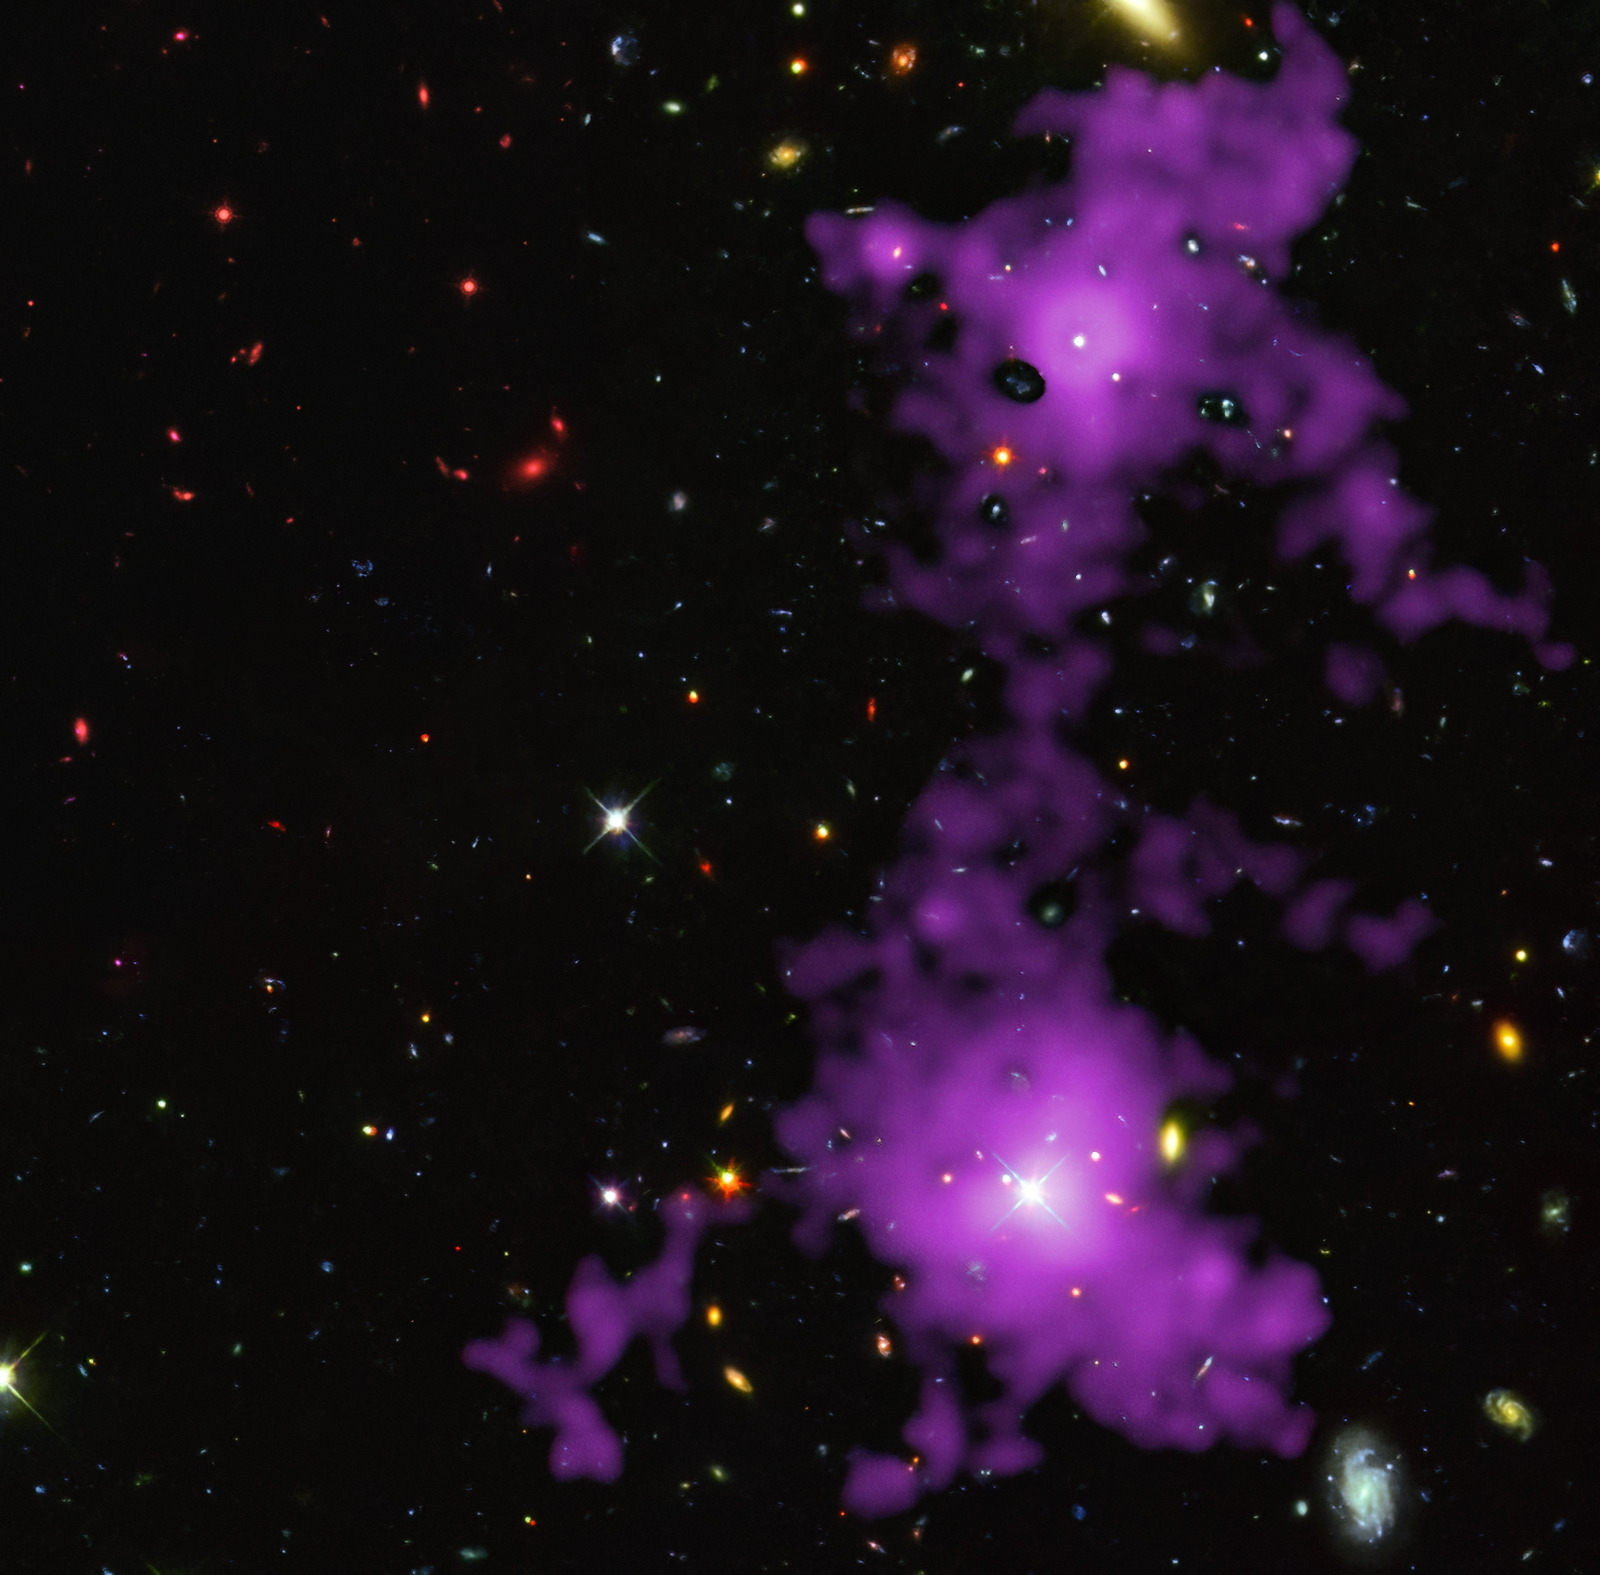
According to the current cosmological picture, supported by observations of the cosmic microwave background, matter in the early Universe was distributed far more evenly than it is today: the differences between dense and sparse regions were small. Over billions of years, gravity gradually amplified these differences. Regions that initially contained slightly more matter attracted surrounding matter and became denser still. Regions that initially contained less matter grew more rarefied. In this way, the initial density inhomogeneities grew into the structures astronomers observe today. The degree to which matter is clustered in the Universe therefore allows scientists to test calculations of what happened in its past.
To test how well they understand this process, scientists create computer simulations of the evolution of the Universe. Researchers specify the initial conditions, the composition of matter, and the properties of the cosmological model’s components, then calculate how matter evolves over time. In the standard cosmological model, dark matter makes up most of the Universe’s matter. Its gravitational influence helps explain the motions of galaxies, the bending of light, and the growth of cosmic structures, although the nature of dark matter itself remains unknown (I discussed how scientists are trying to uncover its nature in my article about the LUX-ZEPLIN experiment). Dark energy plays a different role: in this model, it accounts for the observed acceleration of cosmic expansion. The expansion history, in turn, influences how quickly concentrations of matter grow. By comparing calculations made within this model with the observed distribution of matter, cosmologists test how well the model describes the Universe.
But how can we measure the mass of matter in the Universe if most of that matter emits no light? Weak gravitational lensing offers part of the answer. The gravity of matter along the path of light slightly distorts images of distant galaxies, an effect described by Einstein’s general theory of relativity. Astronomers analyze correlated distortions in the shapes of many distant galaxies to infer the statistical properties of the intervening mass distribution. These measurements underpin cosmological investigations with the Euclid space telescope and the ground-based Vera C. Rubin Observatory.
However, the precision of this test depends on how fully the calculations account for the processes that move matter throughout the Universe. Gas within and around galaxies receives energy from stars and active galactic nuclei. Its motion changes the mass distribution that astronomers reconstruct through lensing. The same observed degree of matter clustering may therefore allow several explanations that combine cosmological parameters with different gas behavior. This raises the key question: how much do gas movements change the measured degree of matter clustering? Sharma and her colleagues’ study focuses on estimating precisely this change.
How Stars and Active Galactic Nuclei Redistribute Gas
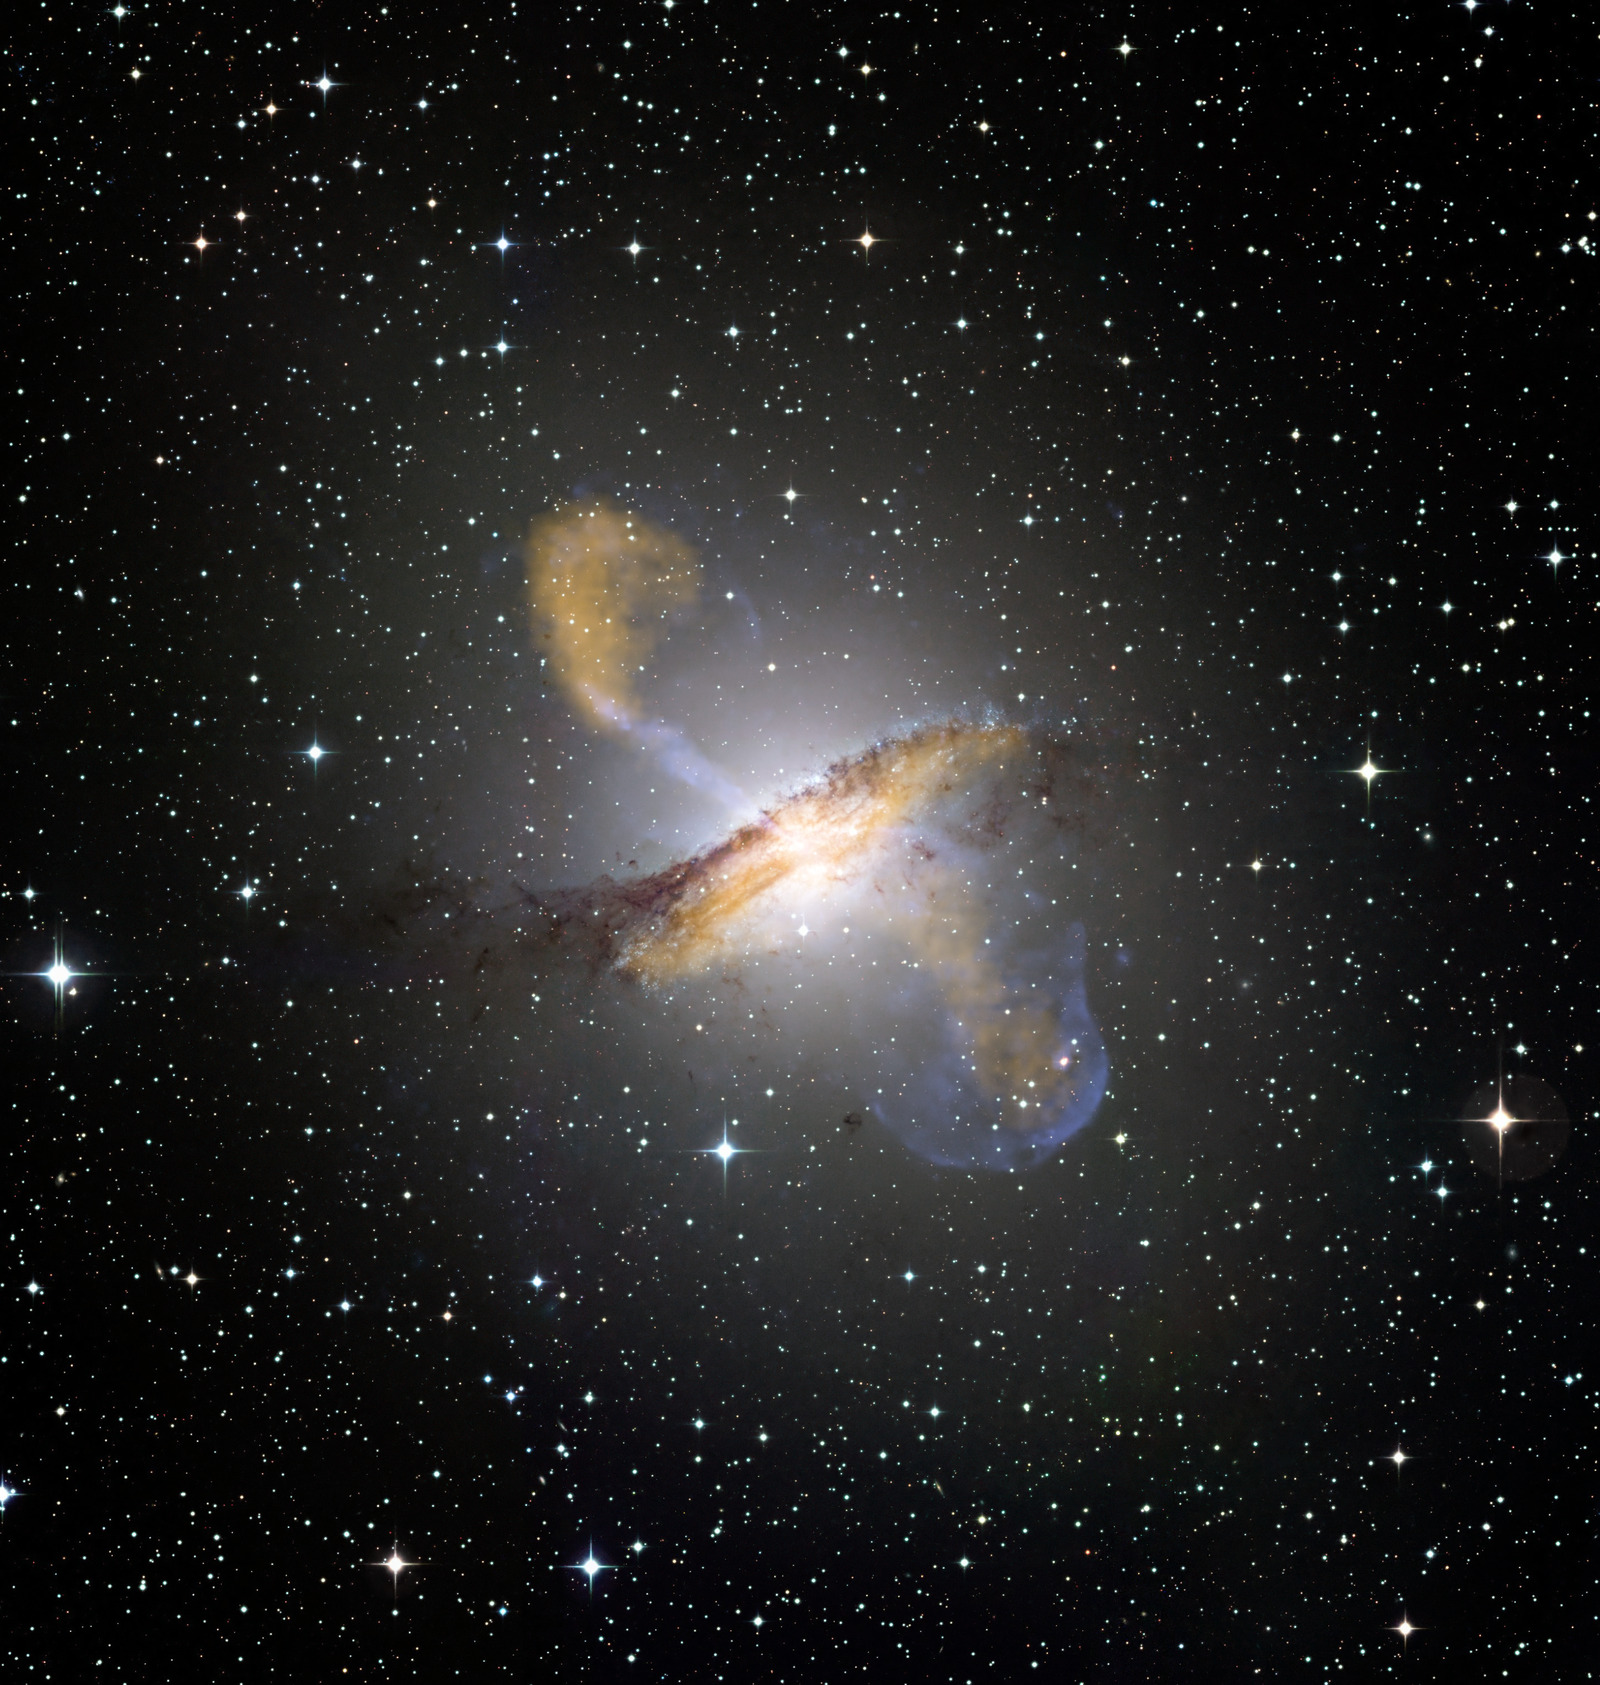
To account for the influence of gas in models of the distribution of matter in the Universe, we need to understand which processes redistribute it. Gas is held within the combined gravitational field of a galaxy and its halo. However, stars and the galaxy’s active nucleus can transfer energy to the gas, changing its temperature and motion. Gas entering a galaxy can cool and condense, forming stars. Massive stars then influence the surrounding gas through their radiation, stellar winds, and supernova explosions. Another energy source lies near the supermassive black hole at the galaxy’s center: matter falling toward it heats up, emits radiation, and can power strong outflows of gas. Such a galactic center is known as an active galactic nucleus.
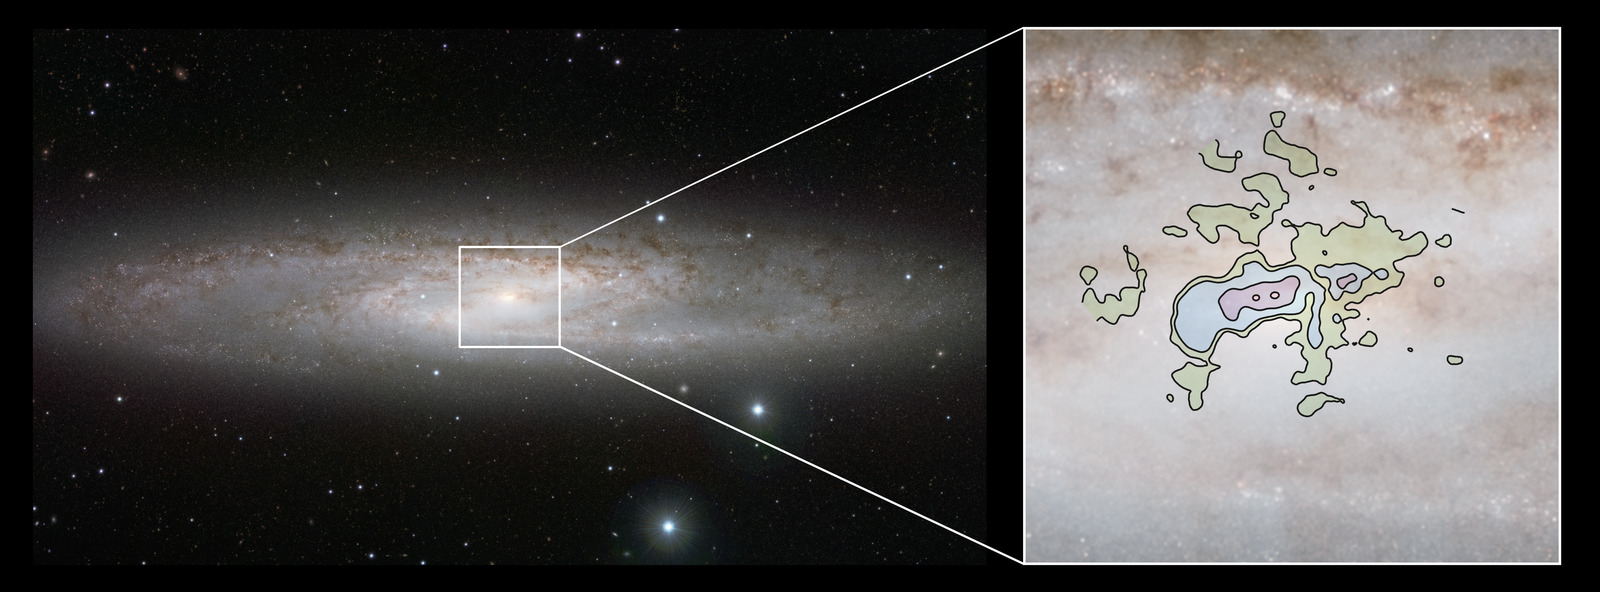
The energy and momentum that gas receives from stars and the active galactic nucleus can move it far from the dense central regions. Yet the gas does not necessarily leave the system: the gravity of the galaxy and its dark matter halo may continue to hold it. Some of the displaced gas eventually returns, while some travels beyond the halo. In this way, the galaxy alters the gas supply available for subsequent generations of stars to form. Astronomers call this influence of stars and the active nucleus on gas “feedback.”
Why is this feedback so important in the context of this study? Because it changes the conditions for the galaxy’s continued growth. Gas that has been heated or has left its central regions becomes less available for the formation of new stars. At the same time, its movement changes the distribution of mass around the galaxy. If some matter leaves the dense galactic center and spreads over a larger volume, the contrast between the center and its surroundings decreases. On the corresponding spatial scales, matter is distributed more smoothly.
For cosmology, the magnitude of this change matters. Gas accounts for part of the total mass and is gravitationally coupled to the rest of the matter, so its redistribution affects the degree of clustering of all matter on the relevant scales. In computer simulations of cosmic structure formation, researchers compare calculations that include gas physics with calculations in which matter evolves under gravity alone. This comparison shows how processes within galaxies alter the distribution of matter when the initial conditions and cosmological parameters are otherwise the same.
The magnitude of the change depends on exactly how the model describes the transfer of energy to gas. For example, IllustrisTNG and SIMBA, cosmological simulations of the formation of large-scale structure in the Universe, use different approaches to account for processes near active galactic nuclei.
How Radio Bursts Help Detect Gas
Having examined how galaxies reshape their gaseous surroundings, let us turn to the study’s main tool: the radio bursts themselves. Much of the gas astronomers are interested in is so diffuse that its own emission is difficult to detect. How can we obtain information about matter that is barely visible in an image? One approach is to observe a signal that has passed through it. Fast radio bursts provide astronomers with such signals: brief pulses of radio emission from distant galaxies, often lasting only milliseconds.
As noted earlier, fast radio bursts (FRBs), a phenomenon scientists have yet to fully explain, are already helping them investigate another poorly understood phenomenon. A radio burst detected in 2020 from the magnetar SGR 1935+2154 in the Milky Way provided strong evidence that magnetars, neutron stars with extremely strong magnetic fields, can produce at least some FRBs. Researchers are also considering hypothetical scenarios involving mergers of compact objects, such as two neutron stars or a neutron star and a black hole.
So one mystery is being used to investigate another. This is possible because the physics of radio-wave propagation through plasma is much better understood than the mechanisms that produce the bursts themselves. Scientists do not need a complete theory of a burst’s origin to measure how gas altered its signal on the way to Earth. The key to this measurement lies in the different delays experienced by different frequency components of the signal.
Free electrons in the plasma produce this difference. They interact with radio waves in such a way that the low-frequency portion of the signal arrives at Earth later than the high-frequency portion. All else being equal, the more free electrons the signal encounters along its path, the greater the difference in arrival times between these portions.
Astronomers use this relationship to determine the dispersion measure, denoted by DM. It characterizes the integrated contribution of free electrons along the line of sight, accounting for the expansion of the Universe. The telescope measures the arrival time of the radiation at different frequencies, and a physical model of its propagation relates the delay to the electron density. In other words, the signal seems to take a roll call of electrons on its way to Earth. Measuring this “roll call” allows astronomers to estimate the total electron contribution, although uncertainty remains about exactly where each parcel of gas was located along the path.
I find the image of a brief chord stretched out in time along its journey fitting here: some “notes” arrived earlier, others later. This is not sound, however: radio waves of different frequencies play the role of the “notes,” and plasma creates the different delays. The extent to which this radio chord has stretched allows us to estimate the total contribution of free electrons along the signal’s path, but not to pinpoint the location of each cloud.
To relate the electron contribution to the amount of gas, researchers account for its composition and degree of ionization: how many electrons the atoms have lost and how many remain bound to them. Each region of ionized gas contributes to DM according to its free-electron density, the length of the path through that region, and its redshift. Even diffuse gas can therefore leave a measurable signature. It does not need to shine brightly to do so. This method alone does not determine the temperature, and neutral matter without free electrons remains outside the scope of direct measurement.
The total delay becomes more informative when astronomers know how far away the source is. A longer path generally passes through more gas. To account for this relationship, researchers identify the galaxy in which the burst occurred and measure its redshift. The expansion of the Universe stretches light waves; within the adopted cosmological model, the amount of this stretching relates the observed galaxy to a distance and a cosmic epoch.
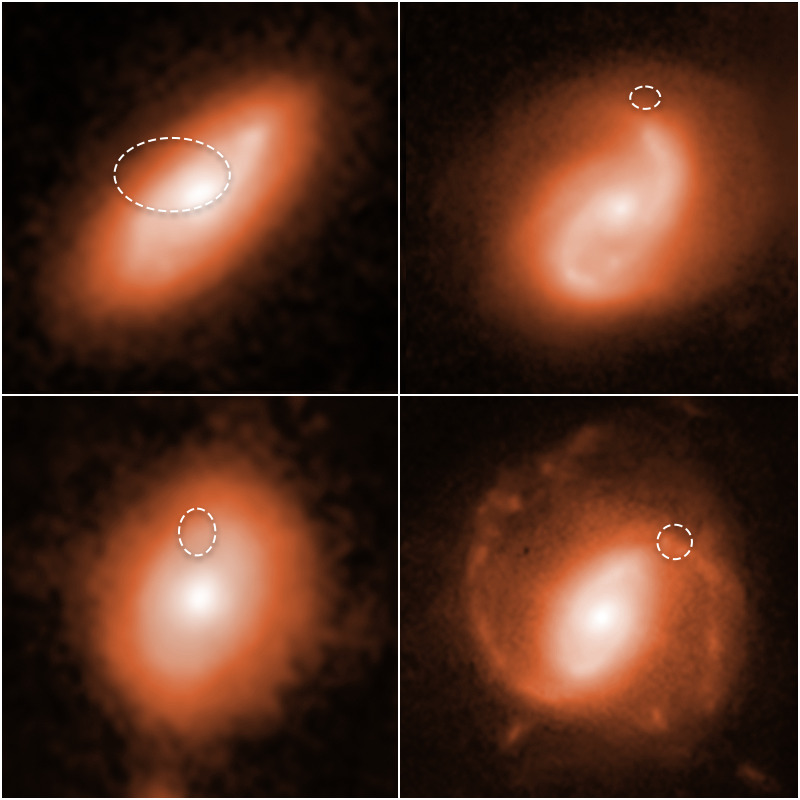
In the April preprint, the authors combined data from several radio telescopes and systems, including DSA-110, ASKAP, CHIME/FRB, MeerKAT, and others. The sample included bursts that could be confidently associated with their host galaxies and for which spectroscopic redshifts had been measured. This selection must be taken into account: telescope sensitivity and the ability to identify the host galaxy influence which bursts enter the analysis.
A 2020 study by radio astronomer Jean-Pierre Macquart and his colleagues had already used the relationship between DM and redshift to estimate the average cosmic density of ordinary matter, known in cosmology as baryonic matter. The obtained estimate agreed with independent cosmological measurements and helped account for diffuse gas that is difficult to detect through its own emission.
Sharma and her colleagues are interested in how this gas is distributed in space, so they compare burst signals arriving from different directions. Sources at comparable distances can have different dispersion measures because their signals pass through different structures.
Radio bursts may originate in galaxies at roughly the same distance from Earth, yet the gas along their signals’ paths can produce different delays. One signal crosses dense regions of gas, while another passes through a more diffuse medium.
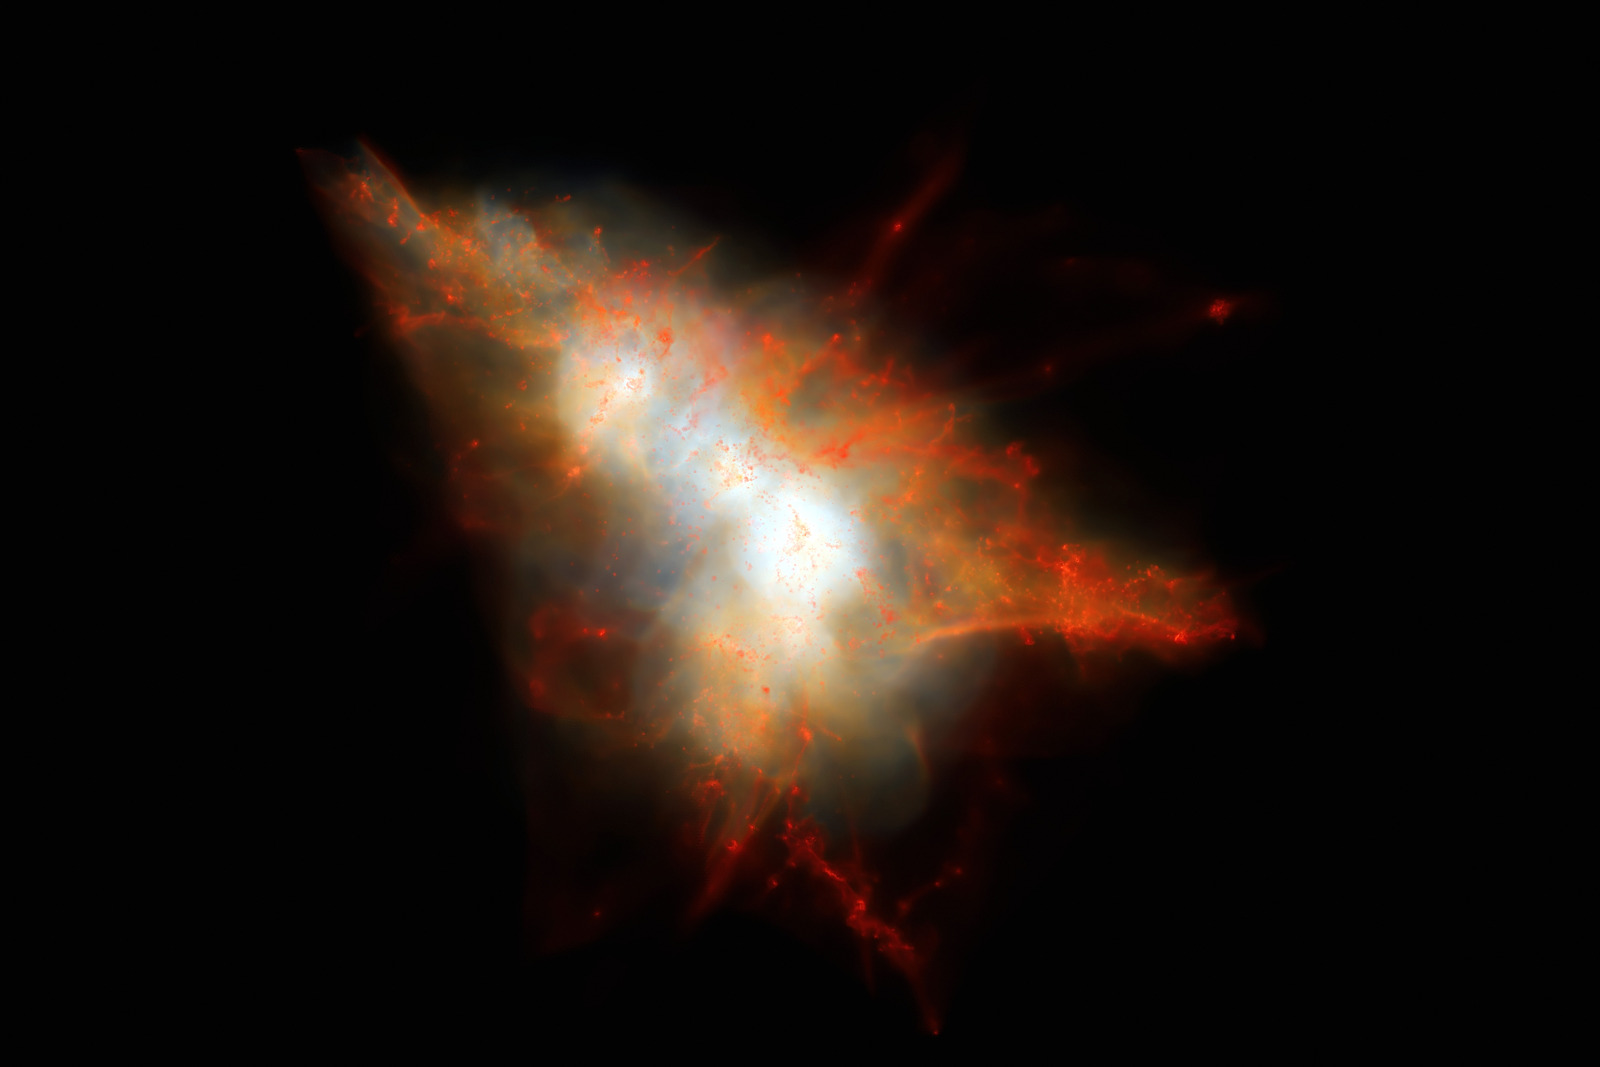
If gas is more concentrated in separate clumps, some signals encounter a large amount of gas, while others encounter very little. All else being equal, this increases the scatter in delays among bursts at comparable distances. Researchers therefore care not only about the average delay but also about how much the delays vary from burst to burst. By comparing this scatter with calculations, scientists test how strongly the gas is concentrated in dense regions or spread over a larger volume.
Astrophysicist Matthew McQuinn described the potential of this approach back in 2014. In 2025, Sharma and her colleagues used simulations to test how the gas distribution relates to the statistics of these delays. The team has now used this relationship to analyze observations.
Some of the delay is caused by gas in the Milky Way, and some by gas in the source’s host galaxy and in the vicinity of the source itself. The authors estimated these contributions using mathematical models of the underlying physics, including fitting a distribution of host-galaxy contributions, to infer the properties of intergalactic gas and gas in halos along the signal’s path. Uncertainty in these corrections remains one of the method’s limitations. They also specified different gas density profiles around galaxies and galaxy groups. One description of the gas profiles was calibrated against hydrodynamic simulations; another allowed the shapes of the gaseous envelopes to vary flexibly. For each variant, they calculated the distribution of delays for sources at different distances and tested how well it agreed with observations.
What Constraints on Gas Distribution Did the Study Obtain?
The April preprint of this study included 109 bursts; in the journal version published in Nature Astronomy in September, the sample grew to 114. The authors first determined which gas distributions were consistent with the measured radio-burst delays. They then used these distributions to calculate how much gas movements reduce the clustering of all matter across different spatial scales. This second step connects the radio-burst observations to the study’s cosmological objective. For comparison, they used a calculation with the same cosmological parameters in which matter interacts only through gravity. This allowed the researchers to estimate how much gas physics changes the mass distribution.
In the April preprint’s analysis, under the adopted model assumptions, the observations point to a moderate smoothing of the matter distribution. The authors investigated this change over a range of wavenumbers, k ≈ 0.1–3 h Mpc⁻¹ (the larger k is, the smaller the density variations being examined). Some simulations in which gas is dispersed to a particularly large extent are less consistent with the result. For the most extreme scenarios, the discrepancies were on the order of two standard deviations, rather than sufficient to rule them out definitively. This comparison helps distinguish among specific feedback scenarios, but its conclusions have limits. The current sample is primarily sensitive to gas in groups and clusters in the relatively nearby Universe, even though the bursts themselves may originate far away. The result therefore cannot be generalized to all galaxies and all epochs.
The telescope records the delay in the radio signal, while researchers use a computer to fit the parameters of a gas distribution model so that the calculated delay statistics agree with observations (the team had previously tested the relationship between radio-signal statistics and gas distribution using cosmological simulations.) This requires additional assumptions: in the analysis described in the April preprint, the authors fixed the cosmological parameters and used external estimates of stellar mass. These estimates help determine how much ordinary matter remains in the form of gas. In the most flexible description of the gas profiles, however, the observations primarily tighten the constraints on a single combination of parameters. The data constrain the combined influence of several gas properties more tightly than they constrain each property individually. The study therefore narrows the range of allowable gas distributions, although it does not yet provide a detailed map of individual clouds.
How well does the resulting picture agree with other ways of observing gas? In the same preliminary radio-burst analysis, the authors inferred a higher gas fraction in groups and clusters than some estimates based on data from the eROSITA X-ray telescope. Differences in the methods’ sensitivity may partly explain the discrepancy: the X-ray signal depends particularly strongly on hot, dense gas, whereas radio-wave delays are also sensitive to diffuse ionized gas. X-ray observations may not fully account for cooler, more diffuse gas. For now, this remains a hypothesis: radio dispersion alone does not measure temperature, and the discrepancy may also depend on the models and object selection.
Overall, this is a familiar situation in observational science: different instruments view matter through different “lenses.” A discrepancy may suggest which portion of the gas one method has undercounted, but it may also arise from systematic errors, object selection, or model assumptions. Determining which explanation is correct is a research question in its own right.
These very differences in sensitivity and sources of error make such comparisons useful: each method allows researchers to check the other’s conclusions. The team behind this study showed that, under the adopted model assumptions, roughly a hundred localized bursts already provide statistical precision comparable to that of several constraints derived from X-ray and microwave data. This makes radio bursts a useful complementary tool for testing how gas is distributed around galaxies.
Testing the Method and Exploring Future Possibilities
In the April preprint, the authors tested whether a single unusual burst was driving the result: they removed each source in turn and repeated the calculation. The conclusion remained robust in this test. They also tested one scenario in which the host-galaxy contribution varied with cosmic epoch.
Other studies continue to test different modeling approaches. The results depend on how researchers describe the gas and compare models. In a separate study, cosmologists Robert Reischke and Steffen Hagstotz also estimated feedback from a sample of roughly 100 localized radio bursts; their paper was published in The Open Journal of Astrophysics in June 2026. They used a model calibrated against the BAHAMAS simulations and found that, within this model, the observations favored fairly strong feedback. Comparing such analyses requires accounting for the samples, model limitations, and descriptions of gas near the sources and in the Milky Way. The differing conclusions pose a specific question to investigate: which aspects of the result are determined by the observations, and which depend on the adopted assumptions?
Larger samples will allow more detailed testing. In the forecasts presented in the preprint, the authors consider roughly ten thousand well-localized sources that can be matched to galaxy surveys. Assembling such a sample will require radio-telescope observations and measurements of host-galaxy redshifts. A detected burst still needs a reliable cosmic address.
As statistical uncertainty decreases, researchers will need to account more precisely for which signals the telescope misses and how source properties change. A large catalog brings more information, along with greater demands on the analysis.
Once enough of this information has accumulated, astronomers will be able to compare sightlines passing at different distances from galaxies of similar mass that lie between us and the burst sources. An extended gaseous envelope should make an additional contribution to the dispersion measure even along sightlines passing far from its center. A more compact distribution should produce a different pattern of variation in this contribution as a function of distance. By repeating the comparison across different cosmic epochs and accounting for source selection, researchers will be able to test whether gaseous envelopes have changed over time. This test will give spatial specificity to an inference that the current sample draws mainly from the overall scatter in delays.
The next level of comparison combines information about gas with weak-lensing maps. Radio signals constrain the distribution of free electrons, while lensing reveals the combined gravitational influence of matter. A joint model must explain both types of observations. If the description of the gas passes this test, cosmologists will be able to use the corresponding scales more confidently to study the structure of the Universe.
A radio burst lasts only an instant, and the gas leaves a trace of the immense distance traveled in the burst’s signal. We are learning to read this trace using timing measurements, our knowledge of plasma, and testable models of matter distribution. I am reminded here of the words of astronomer and science communicator Carl Sagan: “The universe will always be much richer than our ability to understand.” And yet, through such fleeting flashes, among other means, we are gradually coming to understand its structure.
Sources
- Sharma K. et al. (2026). Signatures of suppressed matter clustering revealed by fast radio bursts. Nature Astronomy. DOI: 10.1038/s41550-026-02957-9.
- Planck Collaboration. (2020). Planck 2018 results. VI. Cosmological parameters. Astronomy & Astrophysics 641, A6. DOI: 10.1051/0004-6361/201833910; arXiv:1807.06209.
- Bond J. R., Kofman L., Pogosyan D. (1996). How filaments of galaxies are woven into the cosmic web. Nature 380, 603–606. DOI: 10.1038/380603a0; arXiv:astro-ph/9512141.
- Euclid Collaboration (Mellier Y. et al.). (2025). Euclid. I. Overview of the Euclid mission. Astronomy & Astrophysics 697, A1. DOI: 10.1051/0004-6361/202450810; arXiv:2405.13491.
- Ivezić Ž. et al. (2019). LSST: From Science Drivers to Reference Design and Anticipated Data Products. The Astrophysical Journal 873, 111. DOI: 10.3847/1538-4357/ab042c; arXiv:0805.2366.
- Pillepich A. et al. (2018). Simulating Galaxy Formation with the IllustrisTNG Model. Monthly Notices of the Royal Astronomical Society 473, 4077–4106. DOI: 10.1093/mnras/stx2656; arXiv:1703.02970.
- Davé R. et al. (2019). Simba: Cosmological Simulations with Black Hole Growth and Feedback. Monthly Notices of the Royal Astronomical Society 486, 2827–2849. DOI: 10.1093/mnras/stz937; arXiv:1901.10203.
- CHIME/FRB Collaboration et al. (2020). A bright millisecond-duration radio burst from a Galactic magnetar. Nature 587, 54–58. DOI: 10.1038/s41586-020-2863-y; arXiv:2005.10324.
- Gourdji K., Rowlinson A., Wijers R. A. M. J., Goldstein A. (2020). Constraining a neutron star merger origin for localized fast radio bursts. Monthly Notices of the Royal Astronomical Society 497, 3131–3141. DOI: 10.1093/mnras/staa2128.
- Sharma K. et al. (2026). Signatures of Suppressed Matter Clustering revealed by Fast Radio Bursts. arXiv:2604.17162v1. Preprint, version with a sample of 109 sources.
- Macquart J.-P. et al. (2020). A census of baryons in the Universe from localized fast radio bursts. Nature 581, 391–395. DOI: 10.1038/s41586-020-2300-2; arXiv:2005.13161.
- McQuinn M. (2014). Locating the “Missing” Baryons with Extragalactic Dispersion Measure Estimates. The Astrophysical Journal Letters 780, L33. DOI: 10.1088/2041-8205/780/2/L33; arXiv:1309.4451.
- Sharma K. et al. (2025). A Hydrodynamical Simulations-based Model that Connects the FRB DM–Redshift Relation to Suppression of the Matter Power Spectrum via Feedback. The Astrophysical Journal 989, 81. DOI: 10.3847/1538-4357/adeca4; arXiv:2504.18745.
- Reischke R., Hagstotz S. (2026). A first measurement of baryonic feedback with Fast Radio Bursts. The Open Journal of Astrophysics 9. DOI: 10.33232/001c.164244.
- Cott J. (2020). Carl Sagan: Taking On the Cosmos. In: Listening: Interviews, 1970–1989. University of Minnesota Press, pp. 279–290. Interview.