Satellites Show U.S. Oil and Gas Releasing Less Methane per Barrel, Even as Output Rose
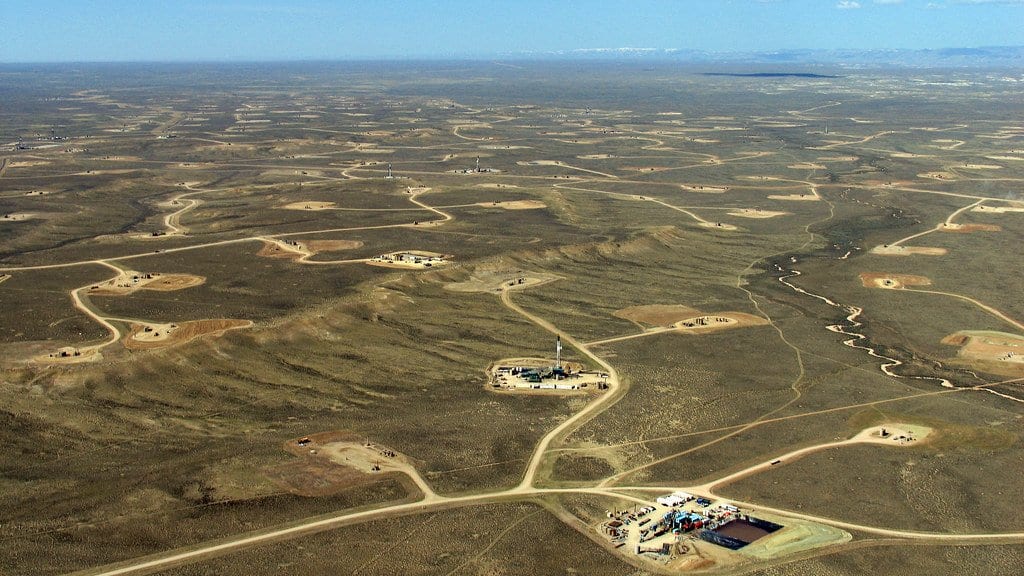
Oil and gas operations in the contiguous United States released less methane for each unit of energy they produced between 2019 and 2024, even as production grew, according to a satellite-based study published Oct. 13, 2026, in Communications Earth & Environment. The same analysis puts the industry's total releases above the federal greenhouse gas inventory for those years.
In the paper, Ao Chen and Scot M. Miller of Johns Hopkins University and colleagues say emissions over this period are largely uncharacterized apart from a handful of inventory estimates, which is why an independent estimate is worth making. Their model works backward from the air: it takes methane measured from orbit by two instruments, TROPOMI and GOSAT, and solves for the ground-level emissions that would explain what the satellites saw. That makes it a check on an inventory assembled from equipment counts and assumed leak rates.
The two results are not in conflict. Intensity is emissions divided by energy produced, so it can fall while the total barely moves, and the comparison with the inventory is about the size of the total, not its direction. The authors report that the inventory follows the downward trend in intensity but likely understates how much methane is being released, a gap they say matches other atmosphere-based estimates from the past decade.
Emissions did not keep falling at the end of the record. Their central estimate shows emissions rising from 2023 to 2024, with the low end of their model ensemble showing no change at all. They report little sign that the federal methane policy window that opened in 2021, including a charge on methane first due to be assessed in 2024, had a detectable effect in the study period. They attribute the multi-year decline in intensity to gradual technological and operational change and to earlier federal leak detection and repair rules. They add that they cannot rule out emissions having risen further without those measures.
The blended satellite methane record behind the study is public, and the model code is posted on Zenodo.
Sources
- Communications Earth & EnvironmentPeer-reviewed