Ice-Age Valleys Mark Where Fresher Water Lies Beneath the North Sea
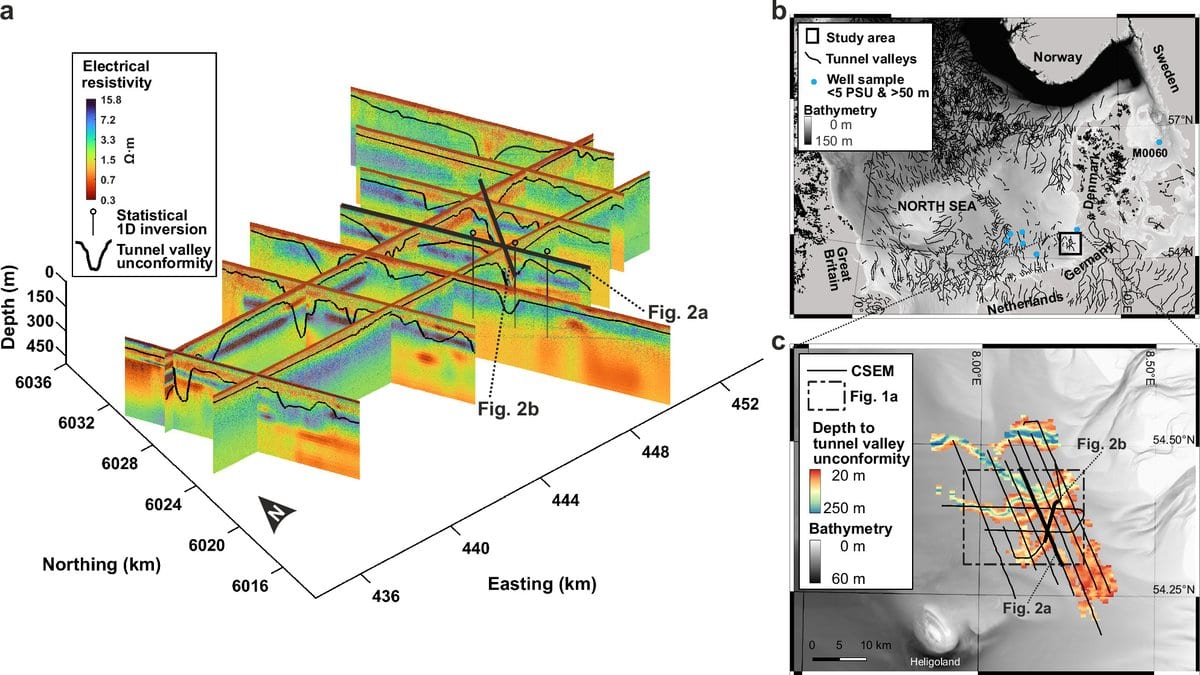
A survey of the seabed off Germany has mapped a continuous body of groundwater fresher than seawater in the sediments below, and tied its outline to valleys that meltwater cut beneath the ice sheets of past ice ages. Arne Lohrberg of Christian-Albrechts-Universität zu Kiel and colleagues report it from the southeastern North Sea.
Lohrberg and colleagues published the work Oct. 17, 2026, in Communications Earth & Environment, and put it forward as a screening tool. Buried valleys of this kind are already mapped in seismic archives collected across shelves that once lay beneath ice, so the link gives a testable criterion for where to survey next. They name the Baltic Sea and the Barents Sea shelf among the candidates.
The survey towed an electromagnetic system at the sea surface to measure how strongly the sediment below resists an electric current, then read the result against seismic profiles along the same lines: 320 km of data on 10 profiles northwest of Heligoland. The models show a band of raised resistivity of 8–14 Ω·m about 100 to 250 m beneath the seafloor, crossing layers from the Pleistocene to the Eocene and reaching well past the valleys themselves.
Resistivity is not a measurement of water, and the fresher body is an inference from it: salty porewater carries a current easily, fresher porewater does not. The authors calculate that readings in this range require water between brackish and near-fresh. They conclude the pattern is best explained by meltwater flushing salt out of the sediment pores during the Pleistocene glaciations, and that fine-grained glacial muds later sealed the system from above.
The authors say rain soaking into the exposed shelf may have contributed, but they regard it as unlikely to have been the dominant process. Similar resistive features have been reported off New Jersey and New England, which the authors read as a sign that comparable bodies likely lie under other once-glaciated shelves.
How much water is down there is not established. The authors write that quantifying it will take geophysical, chemical and sedimentological work at basin scale.
Sources
- Communications Earth & EnvironmentPeer-reviewed