A Million Simulated Years Show What Southeast Spain's Earthquake Record Misses

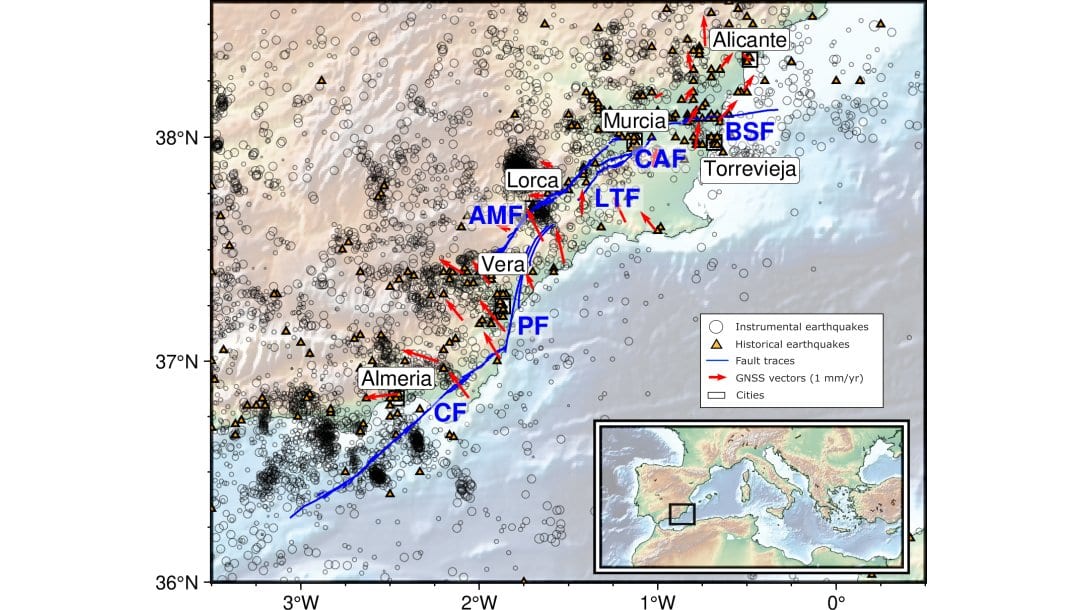
The faults that run beneath Murcia, Lorca and Alicante are in no hurry. They slip past one another slowly, and the large earthquakes they produce arrive thousands of years apart. The written record of earthquakes in southeastern Spain, by contrast, begins with the Orihuela earthquake of 1048 and is barely a thousand years long. That is long, as earthquake records go, and it still does not cover one full cycle on the region's slowest faults.
So a hazard estimate for these cities rests on a single sample of the seismic past, drawn from whichever stretch of it happened to get written down. A study published Oct. 27, 2026, in Natural Hazards and Earth System Sciences takes an unusual route around that problem: if the real record is too short, borrow a longer one from a computer. Elena Pascual-Sánchez of the Universidad Politécnica de Madrid and three colleagues at the Universidad Complutense de Madrid and the Instituto Geológico y Minero de España, part of Spain's national research council, worked from a simulated million-year history of the same fault system.
That history is not an observation. It is output from RSQSim, a simulator that models friction on a fault and lets stress build and release across a model of the fault system's real geometry. The million-year run was produced in 2021 by Paula Herrero-Barbero and colleagues, who fitted that geometry and the faults' measured slip rates to the simulator; the same simulations were later used to ask whether the Carboneras fault, offshore to the south, could drive a tsunami.
The team cut the million years into ten thousand windows, each the same length as the real record and each starting at a random point. The windows disagreed with one another sharply: about how often earthquakes of each size showed up, and about the largest one they contained. A hundred were then run through the standard probability calculation used to set design values in building codes, known as probabilistic seismic hazard assessment, and compared with the same calculation run on the real record. The authors argue the hundred stand in fairly for the rest: their statistics show no systematic bias against the full ten thousand, and a hundred was what the hazard software could handle.
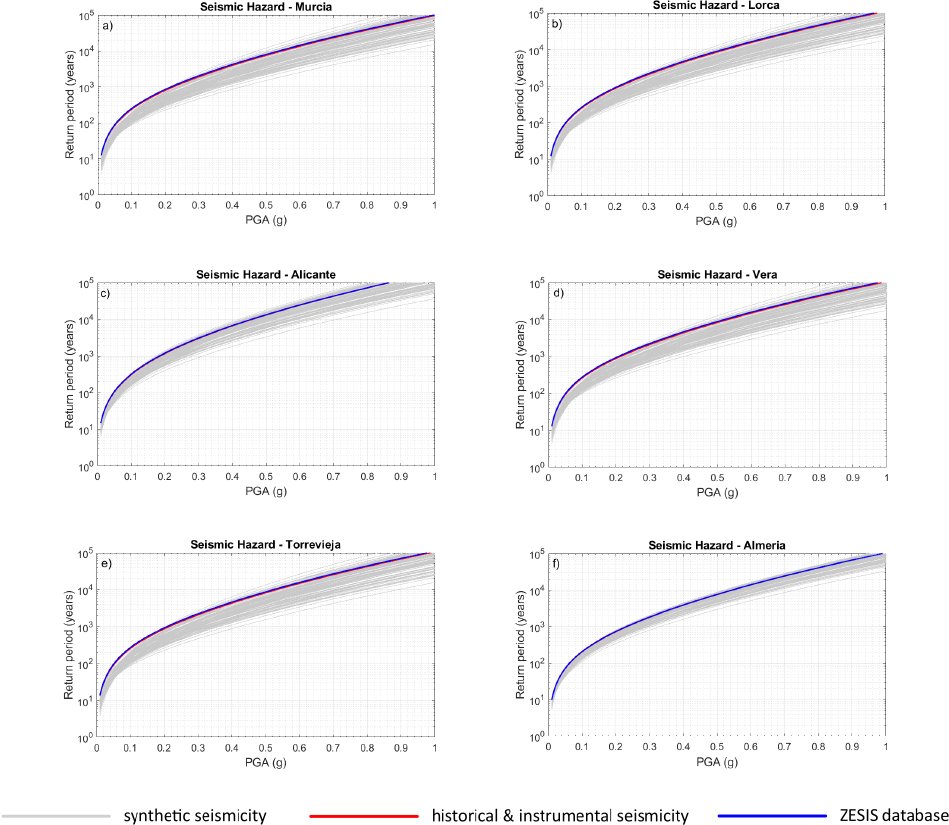
What the paper reports is what it calls the return period variability coefficient: the scatter in an estimated return period, the average wait between jolts of a given strength, measured as a share of that average. Strength here is peak ground acceleration, in fractions of gravity. For a weak shake of 0.04 g, it ran from 11% to 21%, depending on which of the six cities was examined. At 1 g, the far end of the curve, it ran from 25% to 58%. "This range of variability means that the standard deviation is high in relation to the mean hazard curve," the authors write. The 0.04 g figure is not simply the quiet end of the scale. It sits close to where the scatter bottoms out; below the turning point, which falls between 0.02 g and 0.05 g city by city, the coefficient climbs again.
The ten thousand windows said something about the faults as well. Large earthquakes that break several neighboring faults at once turned up often enough that the authors call them more common than previously thought, starting mostly on the Alhama de Murcia and Carboneras faults. Those are the events that move an estimate. Whether a given thousand-year window happens to contain one is much of what decides where its hazard curve ends up.
None of which means buildings in Murcia are underdesigned, and the paper is careful about it. Rare large ruptures "do not necessarily dominate hazard at engineering return periods in classical PSHA frameworks." At short waits, "the range of values is tiny and variability seems to be modest"; the spread widens for waits longer than five thousand years. Even at the return period normally used for ordinary buildings, the range of ground motions across the hundred pasts is wide enough to bear on how design values are set. And the scatter they measure answers a narrower question than it may seem. It is what the length of the record alone does, inside one simulator's assumptions, with other sources of uncertainty left out of the study's scope on purpose.
The paper's comparison with the real record is the finding most likely to surprise. Hazard curves built from southeastern Spain's actual historical and instrumental earthquakes came out as "one of the less conservative results for almost all the values of PGA": the real past implies longer waits between strong shakes, and so less hazard, than most of the invented ones do. The authors read that as a sampling effect. A thousand years is long enough to miss the region's rare large earthquakes, and a record that misses them makes the fault system look calmer than it is. The national seismogenic-zone database the study also tested behaves the same way. They stop short of claiming the simulations are right. The model assumes the faults stay fully locked between earthquakes, which likely inflates the total energy released and with it the estimated hazard, and "the possibility that the synthetic model overestimates seismic activity rates cannot be entirely ruled out."
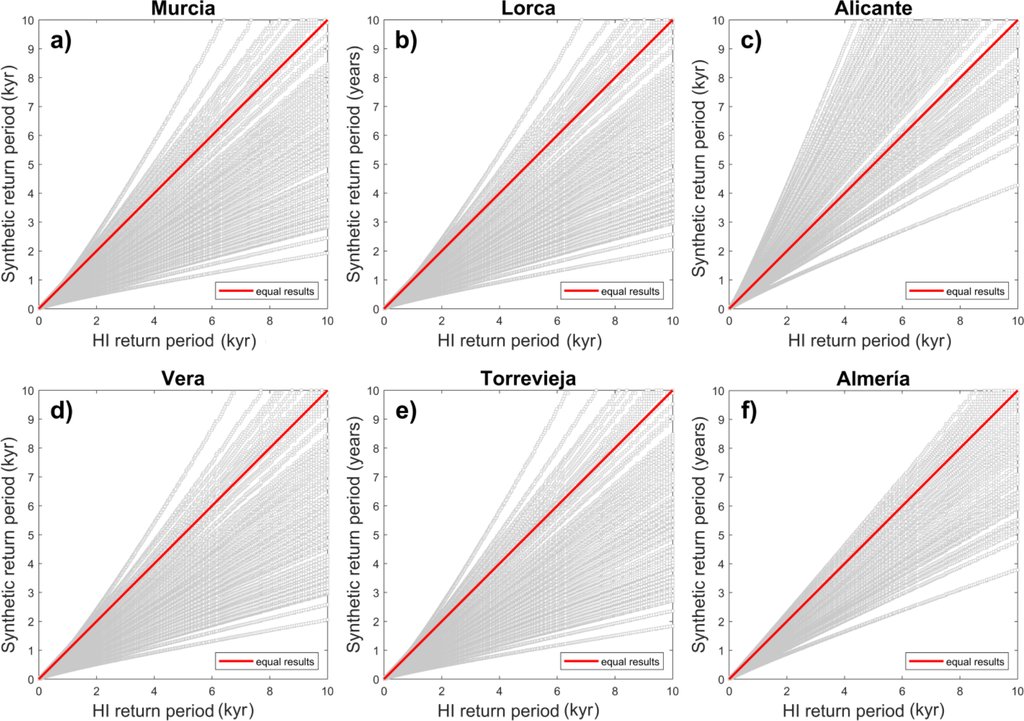
The work hands a hazard modeler a way to measure that blind spot instead of arguing about it. The method needs a well-mapped fault system and a simulator that has been tested on it, which is why the authors picked the Eastern Betics, a region they know well. The paper is open access and the catalogs behind it are posted publicly. Their suggestion for next time is a faster-moving region, where cycles are short enough that a thousand-year record might actually cover one.