Four in Five of China's Hail Days Come With a Storm Cluster Overhead

On a summer afternoon over the Yangtze plain, thunderstorms can merge into one rain-bearing mass wide enough to shade a province, and hold together for hours. Meteorologists call it a mesoscale convective system, or MCS: a storm cluster rather than a storm. What reaches the ground underneath can be a flooding downpour, a gale, a fall of hail, a tornado. Jie Feng, Jian Yang and Zhongdong Duan, engineers at Harbin Institute of Technology (Shenzhen) and Dongguan University of Technology, set out to count how much of Asia's damaging weather happens under one. Their answers were published Nov. 10, 2026, in Natural Hazards and Earth System Sciences.
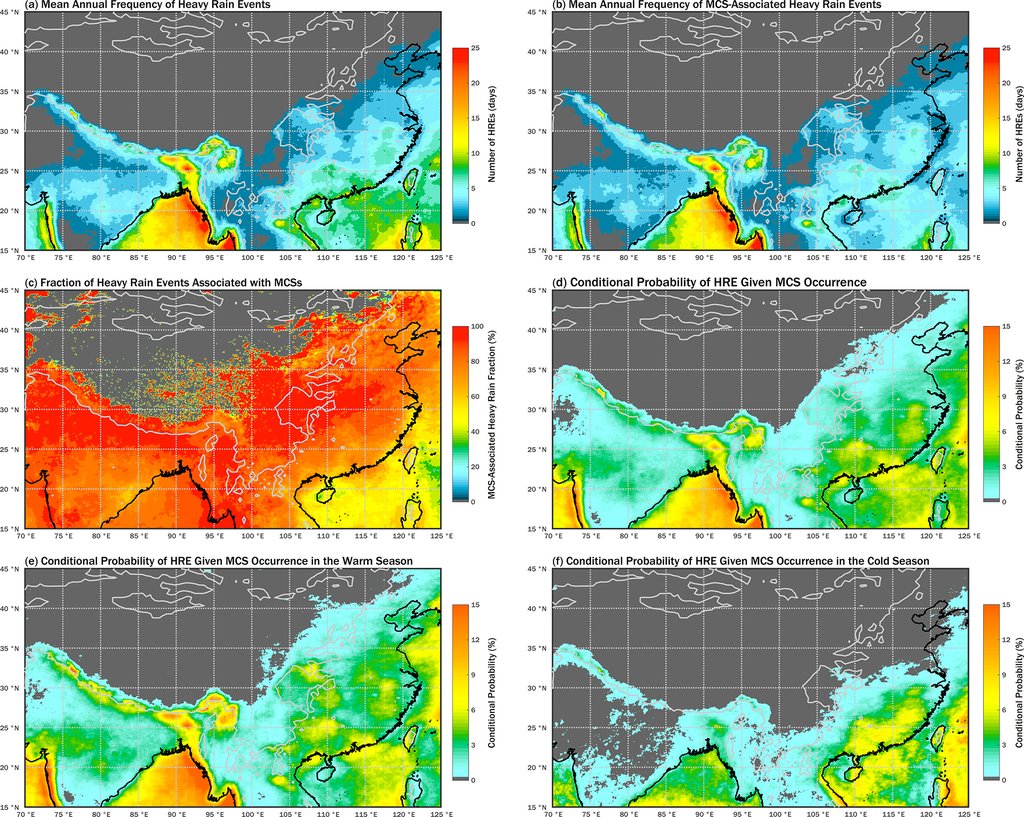
The database covers 2001 to 2023, in a box reaching from the Arabian Sea to the coast of northeastern China. Across most of it, the clusters are associated with more than half of all precipitation, and with more than 70 percent of heavy rainfall events over land, meaning a day with more than 50 millimeters of rain. Those two shares are region-wide. The next three are not: only China keeps severe-weather records detailed enough to match day by day, so the figures for wind, hail and tornadoes cover the Chinese mainland alone.
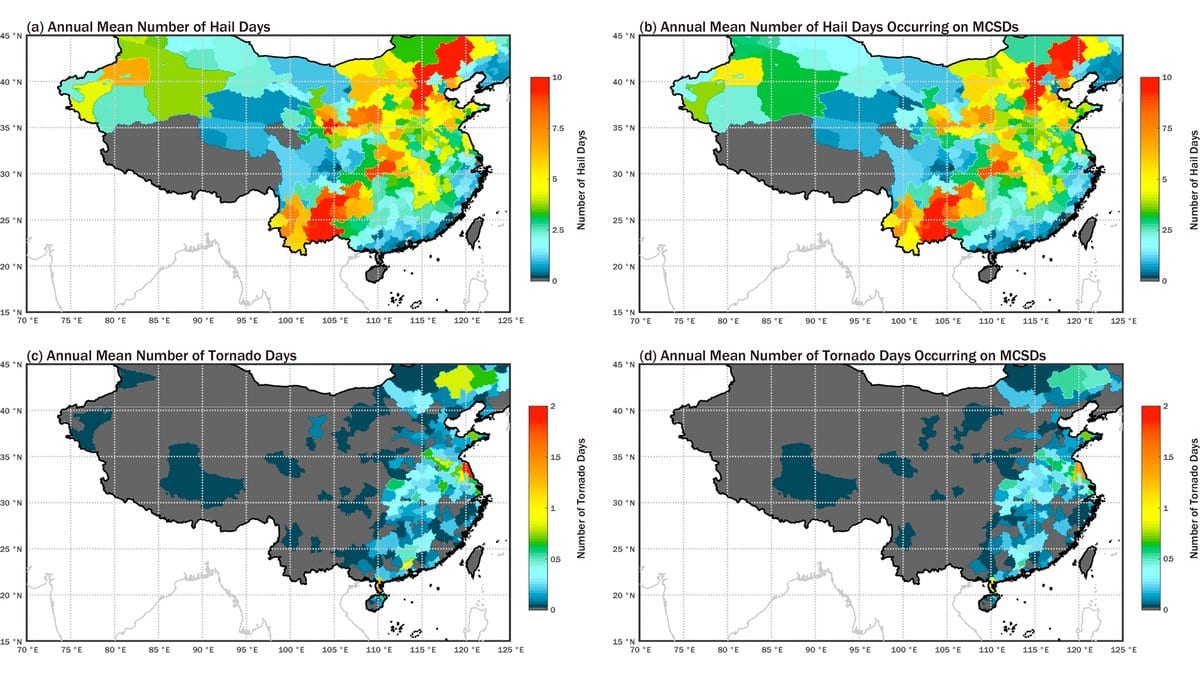
Of the strong wind events logged by China's national station network between 2008 and 2022, meaning a day whose peak gust reached gale force, 47 percent fell on days when a cluster was overhead. Of the hail days in the China Meteorological Administration's disaster yearbook for 2003 to 2020, 82 percent did, and 72 percent of tornado days. The authors are precise about what those shares are: the fraction of hazard days that land on cluster days in the same prefecture, matched a calendar day at a time, and not a fraction of hail or tornadoes the clusters made.
A cluster overhead, and still a small chance of hail
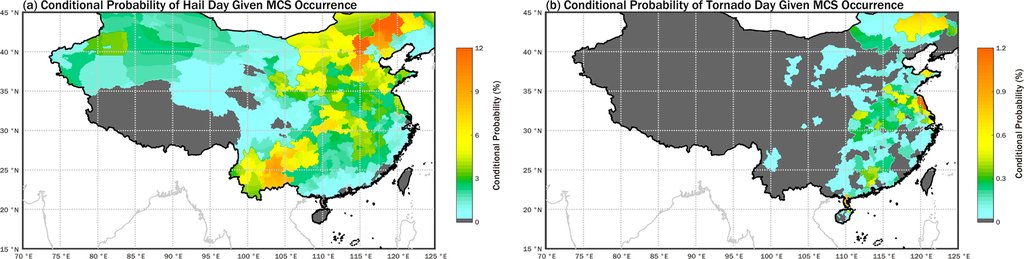
Turned the other way, the same data looks very different. In the hail belt from the Yungui Plateau to the Northeast China Plain, the chance of hail on any day a cluster passes is 3 percent to 14 percent. For tornadoes, even where they are most common, it is about 1 percent. In southern China most gales do fall on cluster days, and yet a cluster day there carries only about a 1 percent chance of one. The clusters are the weather these hazards happen inside: common enough that a rare event almost always has one overhead, and far too common for one overhead to be a warning by itself.
The authors flag the inflation themselves. The impact area they give each cluster is generous: the circle that encloses the system's bounding box, drawn wide because a storm moves between satellite images half an hour apart. Combined with matching by the day rather than by the hour, they write, it "may lead to an overestimation of the association between MCS activity and weather hazards." Hail and tornado records add their own trouble: weak events that never get written down, thin reporting in empty country. That is why the paper says those two links "should be interpreted as statistical co-occurrence at regional and climatological scales."
One published comparison sharpens it. Jingyu Wang, Jiwen Fan and Zhe Feng, tracking clusters by radar across the United States, found 8 to 17 percent of hail events and 17 to 32 percent of tornado events associated with them, several times below the Chinese figures. The two sets are not measuring the same thing, and the paper says so: different criteria for what counts as a cluster, different matching in time and space, different weather.
The east gains, the middle loses, and one half is hazier
Cluster activity over those 23 years did not move in one direction. It rose significantly over eastern China and its adjacent seas and fell significantly in a band from western China across to the Bay of Bengal. An independent group reports the same contrast where the two overlap: Yuanjing Guo and colleagues, tracking clusters over Asia with a different satellite record, find activity rising over East Asia and falling over Southeast Asia. The declining half is the one to hold loosely. High ground lets even modest storms push cloud tops cold enough to be counted, so the count is inflated over the Tibetan Plateau, and the paper says trends there and across western China "should be interpreted with caution."
The second trend is subtler. Over eastern China and its adjacent seas, the chance that a cluster day is also a heavy rainfall day climbed by an average of 2.77 percent a year across the full window, and the chance that it is a gale day by 3.11 percent a year across the shorter wind record. Both are relative rates on a small base, not gains in percentage points: across most of eastern China that heavy rainfall chance is still under 2 percent. Around the Bay of Bengal the chance rose by about 1 percent a year while cluster activity fell, and the two canceled, leaving no significant trend in cluster-related heavy rainfall days there. Given the rises in the east, the authors write, "strengthening preventive measures against weather-related disasters in this region is imperative."
The authors stop short of naming a cause
The paper introduces its trend analysis as a look at hazards "under the influence of climate change." Its introduction, a few pages earlier, says: "It should be noted that, attributing the trend, if there is any detectable signal, to climate change is beyond the scope of this study." Both sentences are theirs, and the second is the one that binds. A two-decade record of how often storm clusters pass is a measurement; nothing in this work separates a warming signal from the ordinary swings of a monsoon.
Two more absences matter. The paper reports no trend at all in hail or tornadoes: the authors judged those records too uncertain, left their year-to-year variation alone, and nothing here says hail is becoming more or less common. And typhoons are not in the database. Cloud systems sitting near the center of a tropical cyclone were identified and removed, so typhoon rain is outside every figure here.
What the work puts in other hands is the database: the whole labeled cloud-field record, openly posted at Zenodo under a reuse license, one zipped file per year. The journal's review is open too, so the referees' reports and the authors' replies sit beside the paper. Until someone matches clusters to hazards by the hour, which the authors say is the way to settle how much their method inflates, the number to hold is not the four in five. It is the few percent chance of hail on the day a cluster happens to pass.