A Tsunami Wall You Can See Through Came Within 10–15% of a Concrete One in 150 Simulations

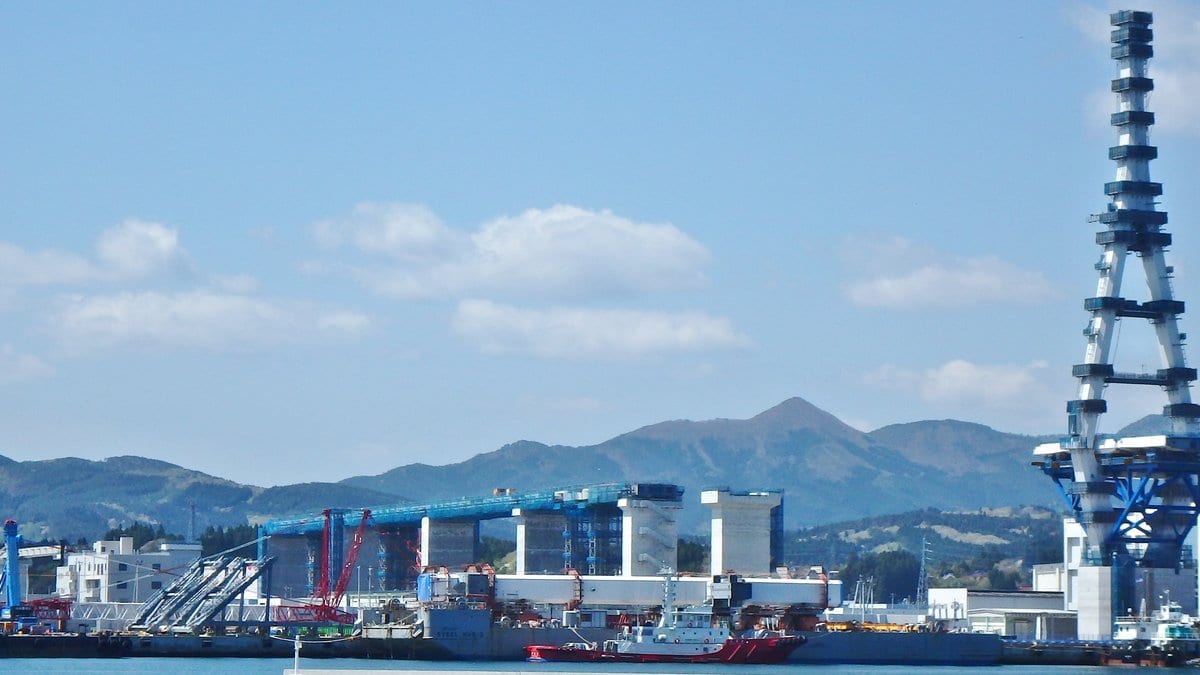
Walk the waterfront in Kesennuma, a fishing city on Japan's Sanriku coast, and parts of the sea wall have windows in them. After the 2011 tsunami wrecked the port, the city asked residents what the rebuilt coast should look like, and the answers changed the concrete: reinforced glass panels along the harbor, barriers that lie flat until water pushes them up, wall heights trimmed in places to keep a sightline. What does a view cost in protection? A study published Oct. 12, 2026, in Natural Hazards and Earth System Sciences tries to price it.
In the study, Hayley Leggett and colleagues at Tohoku University built three sea defenses on paper, each obeying a different priority. The first is the green one: artificial reefs and submerged pile arrays offshore, vegetated berms and drainage swales along the shore, parks inland that double as high ground. The second keeps the sea in view, with a glass-composite sea wall whose automatic floodgates sit flush with the ground and rise on a tsunami alert, low tetrapod fields offshore, rooftop safe zones inland. The third is the engineering maximum: stepped concrete sea walls 5 to 7 meters high, buffer parks that hold overtopping water, floodable channels inland. That height is the only one the paper states, and it belongs to the third design alone.
The modeling ran in TUNAMI-N2, a tsunami code developed at Tohoku that Japanese hazard assessments use. The 150 runs are a full grid of conditions: two districts, central Kesennuma and the Karakuwa Peninsula, crossed with three earthquake sources, five states of defense and five sea levels. The sources are ruptures on the Kuril and Japan trenches plus the 2011 earthquake itself, and the defense states run from a bare coast through the walls Kesennuma has already built to each of the three proposals. For sea level, the team took local projections from NASA's tool built on the IPCC's sixth assessment, at a gauge up the coast, reaching +0.97 m by 2100 on the middle emissions pathway and +1.28 m on the high one. The paper gives no percentile for those values and made no adjustment for vertical land movement.
The ranking came out the same in every run. The reinforced design held back the most water, the see-through design came close behind it, and the green one trailed. The authors state the gap in a single sentence: "Defence 2 achieved comparable results, typically within 10 %–15 % of Defence 3, while maintaining openness and visual integration." That figure is the distance between two designs across flooded area, fatality rate and economic loss. It is not a quantity of flooding either of them prevents. And "typically" is carrying weight: the figure is a rough standing of one design against the other across every sea level tested, not a value belonging to any one of them. The designs separate most late in the century. "The largest differences between designs occurred under late-century SLR," the paper reports.
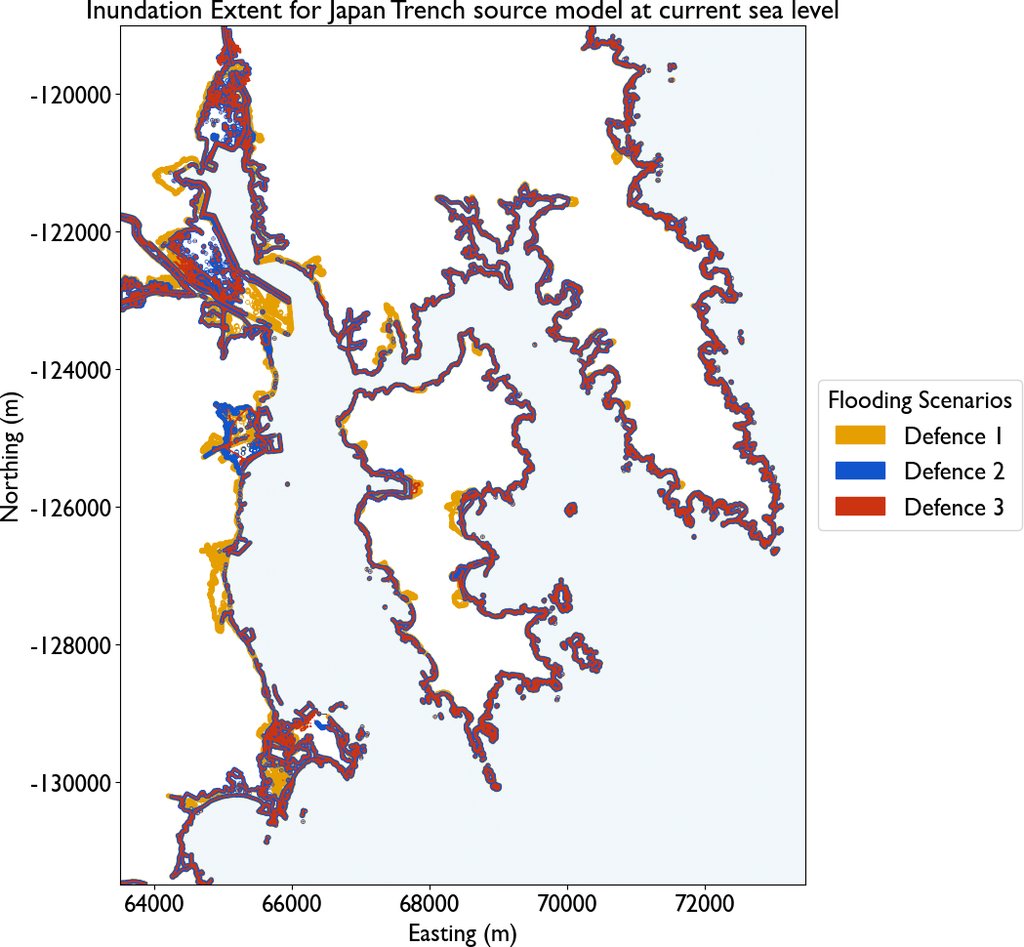
None of it was measured. The flooded areas, the fatality rates and the yen losses are all model output for defenses that have never been built, and the paper says so plainly. TUNAMI-N2 has been checked against real events in earlier published work, the 2011 Tohoku tsunami among them. This study replicates no historical event, and 2011 enters it only as one of the earthquake sources fed to the model. The designs themselves are "conceptual rather than physically validated," never put in a wave tank. The fatality results carry the sharpest warning in the paper: they "should not be interpreted as predictions of real-world casualties," because nothing in the framework models evacuation, warning time or the hour of the day. The authors' summary of the whole exercise is that its results are "indicative rather than predictive."
The green design is the clearest loser and the most interesting one. Berms and swales let water through where a wall stops it, so flooding spread wider and shallower across more buildings, and by 2100 its advantage over a bare coast narrows substantially while the harder designs keep gaining. The authors do not write it off. They call it "unsuitable as a standalone mitigation system" and credit it with "valuable complementary benefits" as one layer among several, which for nature-based coastal protection is a narrow verdict rather than a dismissal.
The study does not establish the thing it is likeliest to be read as establishing. Nobody in Kesennuma has seen these designs. The priorities they were built from come from a separate survey of the city led by the same author, published in November 2025, which found residents wanting visibility and access to the water, defenses that blend into the landscape, and alternatives to concrete. That survey also found them split on the walls they already have, with "roughly equal proportions reporting that they did and did not feel secure behind the new seawalls." Putting the designs in front of residents appears in the conclusion of the new paper as work still to do.
What the modeling supports is narrower than a verdict on sea walls, and more useful: how a defense is arranged, and whether it runs unbroken, counts for more than "structural height alone." Kesennuma arrived at a version of that answer by negotiation, with glass windows and flap gates, before anyone simulated it. What the study adds is a way to test the next round of that bargain before any concrete is poured.