Reading the News in 58 Languages Finds the Floods Global Databases Leave Out
A landslide that kills a few people and closes a mountain road is the whole of the news in the valley where it happens. Whether it also exists in the world's standard record of disasters depends on a threshold. EM-DAT, the database most global hazard research starts from, admits an event when it kills at least 10 people or leaves at least 100 affected. It also admits one when a government declares an emergency or calls for international help. Underneath those bars, across most of the world, the event happens and the record stays empty. A paper published Nov. 2, 2026, in Natural Hazards and Earth System Sciences goes looking for what is missing the way a reporter would, by reading the news.
Bram Valkenborg, a PhD candidate at the Vrije Universiteit Brussel, built the method with Benoît Smets and two more colleagues. Smets works at the same university and at the Royal Museum for Central Africa in Tervuren, Belgium. They call it HazMiner, and it read 6,366,905 news articles published from 2017 through 2024 in 58 languages. Out of them it pulled 24,407 flood, landslide and flash flood events, each one with a place and a date. HazMiner works paragraph by paragraph rather than article by article. One storm story will often describe several floods in several places, and reading it as a single unit keeps only the largest of them.
The authors keep their own summary of the comparison modest. They write that over the same period HazMiner "documented over four times more events than EM-DAT". Their own Table 1 is blunter than that sentence: broken out by hazard and by World Bank income class, its EM-DAT column holds 1,524 entries for the same three hazards and the same eight years.
Two inventories are not counting the same thing
Most of that gap is not an error in either record. An EM-DAT record is a disaster at the level of a country, while a HazMiner event is a cluster of news paragraphs in one place over a few days. The paper does not hold the thresholds constant, and it does not claim to: it names them as the reason for the difference. Those entry criteria are published by CRED at UCLouvain, which keeps the database, alongside a page of the database's own known biases, threshold bias among them. The lead author of EM-DAT's own description paper is thanked in HazMiner's acknowledgments. These are two instruments built for different jobs, and only one of them was ever meant to be a list of catastrophes.
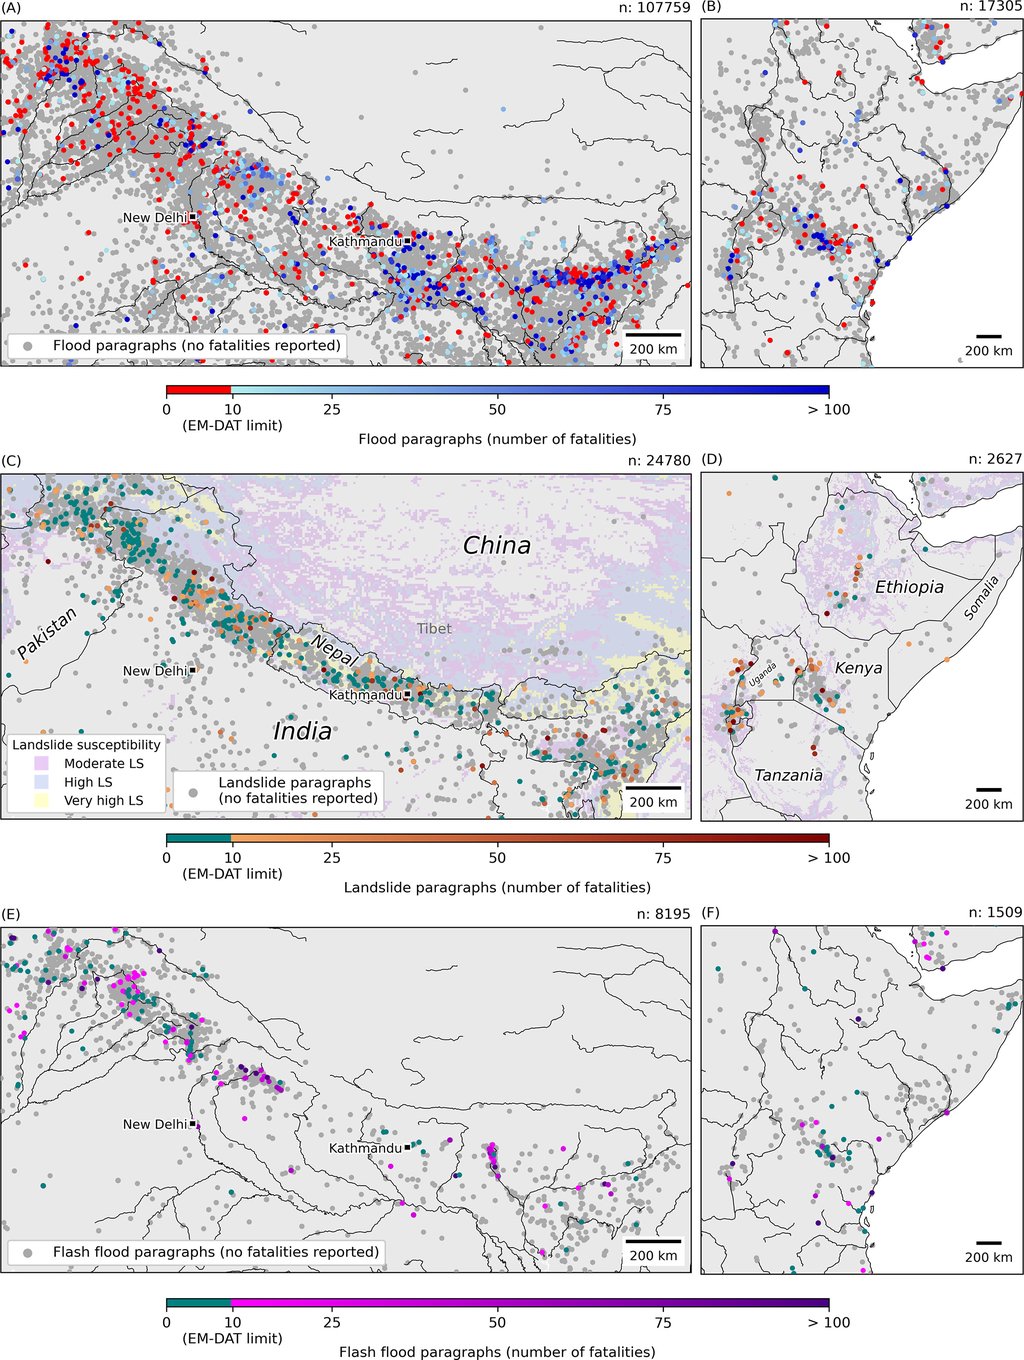
Reading who is missing from the older record needs all three of the paper's results, in that order. The authors conclude that EM-DAT's criteria "result in significant data gaps in low- and lower-middle-income countries". That is an inference about thresholds rather than a measured size of the gap, and the evidence they offer for it is regional: in the Himalayas, among landslide reports that gave any death toll at all, nearly two-thirds named at least one death and fewer than ten, which is below EM-DAT's bar.
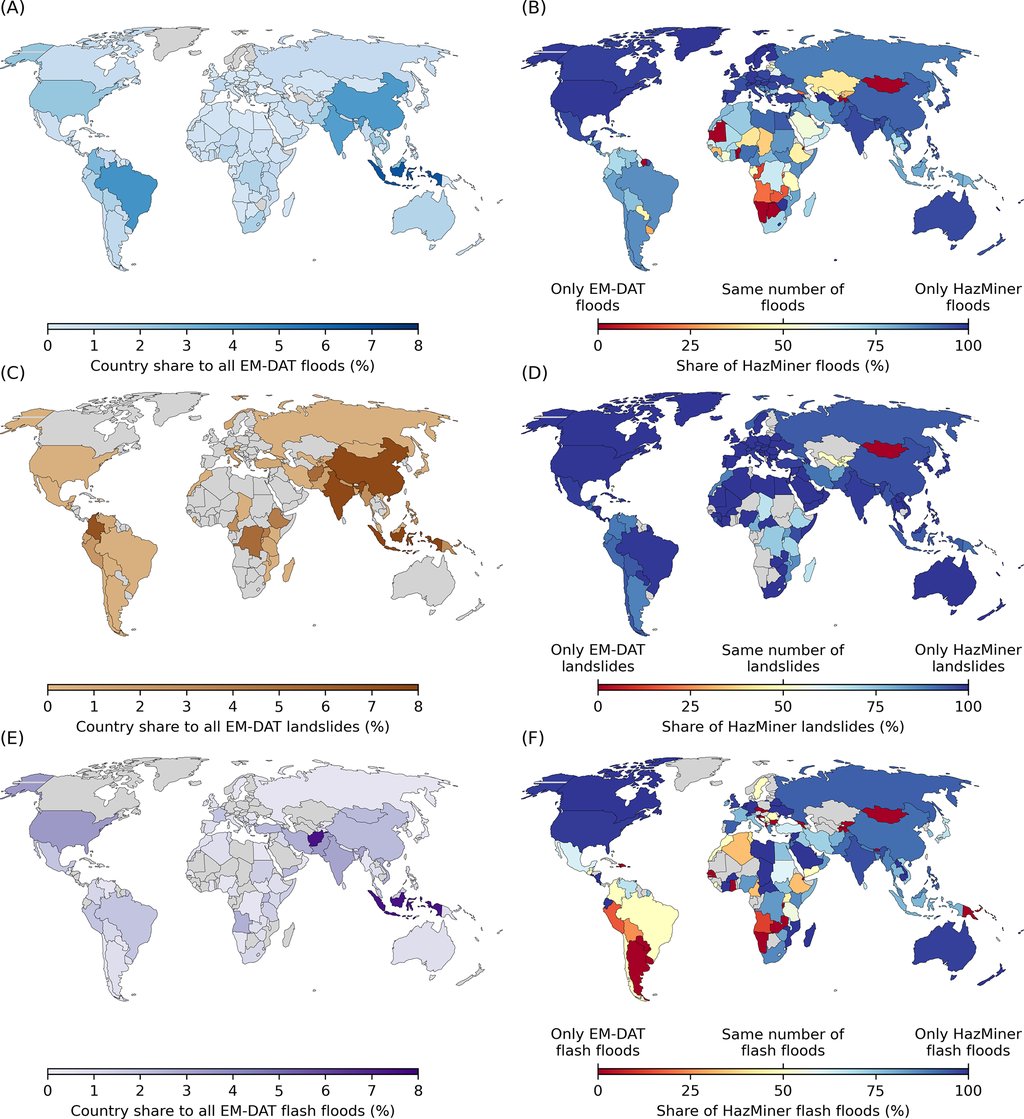
The increase they measured directly runs the other way. Table 1 puts HazMiner at 222 times EM-DAT for landslides in high-income countries, where EM-DAT holds 13 for the whole period, and at its lowest in the low-income class. The paper also says twice that its own map inherits the old tilt, in the plainest terms: "the spatial distribution of events remains biased towards high-income countries". Fewer than a thousand of its events fall in the world's low-income countries.
A lot of what was missing was simply in another language
Two in five of the news sources behind the detected events are not in English, and translating them is most of what the method added in the places global datasets thin out. The authors report that an English-only search would have missed 80% of the events in Germany. The 2021 flood on the German, Belgian and Dutch borders shows the same thing at the scale of one event: its German and Dutch paragraphs covered more ground than its English ones. Translation is also where the method fails most visibly. A Turkish sentence about four million people stranded by a flash flood came out of the translation model as "4 million people lost their lives".
None of this runs on a chatbot. The classifiers are small fine-tuned encoder models, the kind that sort text rather than write it, and the authors make a deliberate argument for choosing them. Sorting a paragraph, spotting a place name and answering a question about a number are not text generation, and the smaller models do those jobs on an ordinary computer, without sending copyrighted news articles off to someone else's service.
The authors print their own error rates
The first filter, the one that decides whether a paragraph is about a hazard at all, misses 41% of the paragraphs that are. Nor is the total a clean count of separate events. The paper states that HazMiner "does not currently post-process duplicate reports of the same hazard event across different news sources", and duplicate events are held apart only by merging clusters that sit almost on top of one another and by using each paragraph once. The figure that belongs beside the count is the hand check: of 75 events read by people, 93% described a real hazard event, 87% carried the right hazard type and 83% the right place, and in 79% the paragraphs gathered under one event really did describe the same one.
What the paper hands anyone who wants it is the whole apparatus. The events and the paragraphs behind them are published on Zenodo under a Creative Commons license, the code sits beside them, and the models come off a public hub. One more column of Table 1 argues that the scale is real rather than an artifact of the miner: an independent flood database, built from news by another group, holds more flood events than HazMiner in every income class. Anyone setting the two records side by side is not choosing between a right one and a wrong one. They are choosing where the bar for a disaster sits.