A Uniform Design Storm Missed 11,518 Buildings in One Louisiana Basin

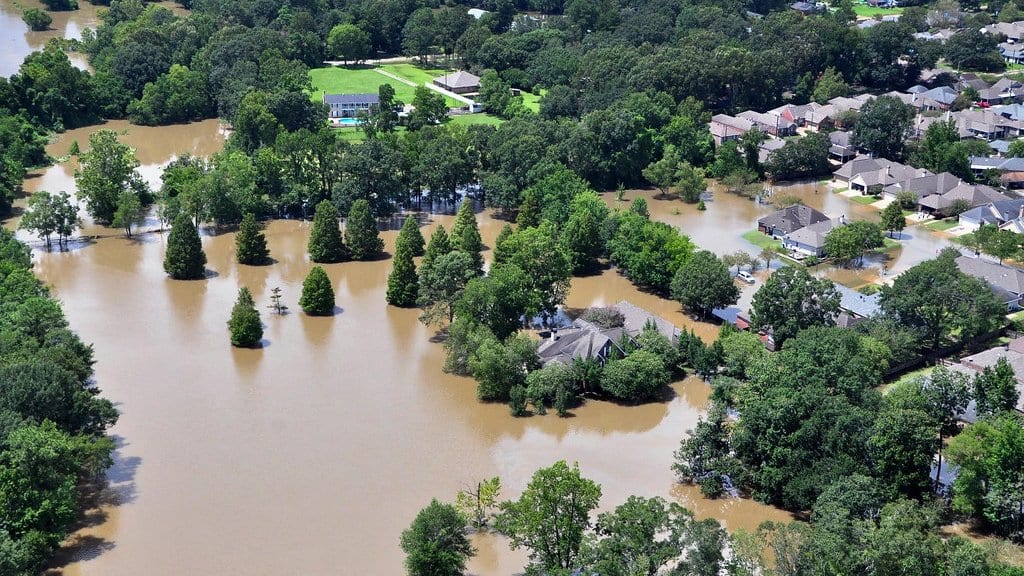
An engineer sizing a drainage channel in south Louisiana starts with one number: how much rain a 100-year, 24-hour storm is expected to drop there. It comes from NOAA's Atlas 14 rainfall tables, and because those tables describe a point while a model needs rain everywhere, that depth gets spread evenly across the whole watershed. Real storms do not oblige. They arrive with a dense core and a ragged edge, and where the core lands decides which streets fill. Mohamed ElSaadani, Emad Habib and Mohamed M. Morsy have now put a number on what the even spreading leaves out, in a paper published Oct. 23, 2026, in Natural Hazards and Earth System Sciences.
The three work at the Louisiana Watershed Flood Center at the University of Louisiana at Lafayette, where Morsy also holds a post at Cairo University. Their comparison took the Vermilion River Basin, a flat run of city, farmland and swamp draining past Lafayette and Abbeville toward the Gulf of Mexico. It came with a calibrated flood model of its channels, bridges and floodplain storage, built for the state's watershed program. The team ran that model once with the uniform Atlas 14 storm, then ran it 50 more times with rainfall fields that real storms had actually produced, lifted from the national radar archive and set back down over the basin at randomly chosen positions.
Those 50 fields are not 50 different storms. They come from a technique called stochastic storm transposition: pick up a whole observed storm and set it down somewhere else nearby. The ones carried through to the flood model were screened from a large catalog of storms in the radar record and draw on six parent events. What changes between runs is mostly where the rain falls, not how much of it falls.
Against the baseline, the repositioned storms put water above the first floor of 11,518 buildings that the uniform storm left dry. The exclusion is a matter of definition, not of approximation: a building joins that group only if its depth above first-floor level is zero in the baseline run and above zero in at least one of the repositioned runs. The water was shallow. Median depths for the group ran between 8 and 13 centimeters above the first floor, and most of those buildings flooded in only one to four of the 50 runs. Summed across all of them, the structural loss comes to more than USD 110 million, which is how ElSaadani and his colleagues frame the result: an aggregate loss signal, not a catastrophe map.
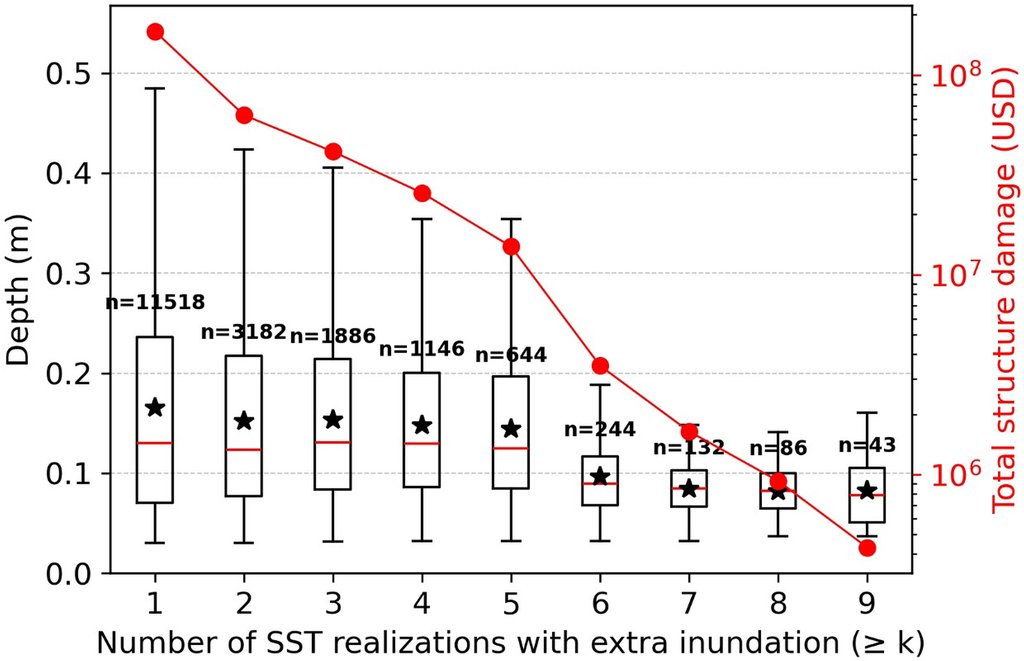
The comparison runs in both directions. The uniform storm flooded 312 buildings that none of the repositioned runs reached, in water shallow enough that the damage barely registers.
The houses that sit just above the water
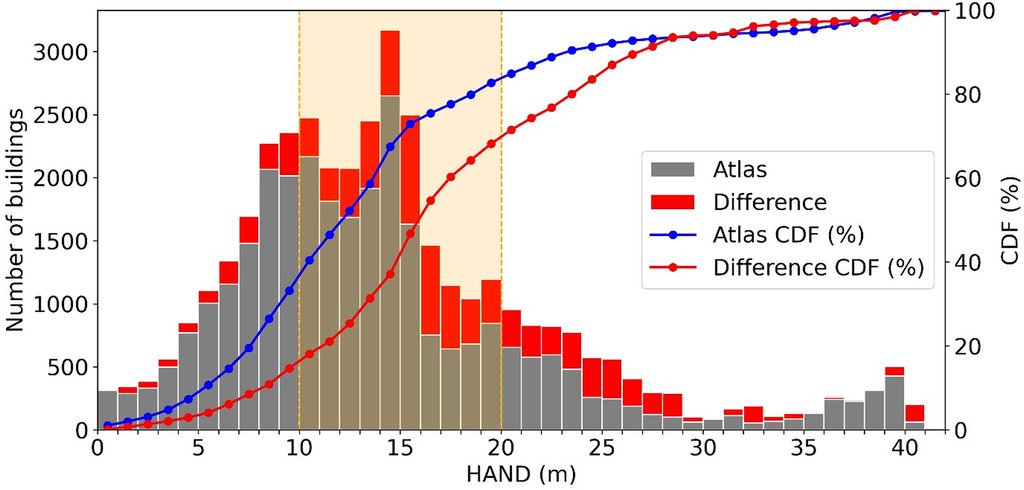
Where the extra buildings are is the more interesting half of the result. They are not down on the floodplain, which floods under either kind of storm, and not up on high ground, which floods under neither. They sit in the transition between the two. The paper pins that position with height above nearest drainage: the vertical distance from a patch of ground to the nearest channel the water can leave by. Most of the disagreement between the two methods falls in a band 10 to 20 meters above it. Those are neighborhoods in west Lafayette, Scott and Abbeville. A house there sits near its own flooding threshold, close enough that a rainfall core parked overhead pushes it across, while the same rain smeared over the whole basin does not.
More rain on paper, and still not the worst case
The easy reading of all this is that Atlas 14 is a soft estimate. It is not, and the authors say so plainly. The uniform storm carried more rain than the average repositioned one, 310 millimeters across the basin after the standard area adjustment, against 238 millimeters. In damage, it landed in the top tenth: its roughly USD 0.48 billion of structural loss slightly exceeds what the 90th-percentile composite of the repositioned runs produced. What the uniform storm misses is the envelope. Take the deepest water any run produced at each point on the map, and the resulting composite is worth about USD 0.92 billion, close to twice the baseline. That composite is not a storm and never happened; it is an upper bound assembled from runs that did not occur together. Stress tests of the uniform storm, including one at the upper bound of Atlas 14's own uncertainty range, all stayed below it.
The conclusion stops at the basin line
This is one basin, and the authors keep the claim inside it. Their conclusion is that uniform design-storm runs need supplementing where rain-driven flooding away from the river channel matters, and where consequences are counted building by building, and explicitly not that Atlas 14 should be replaced in design practice. The placements tested are what a detailed model can afford rather than an exhaustive sample of where a 100-year storm might sit. The result depends on the region the storms were allowed to move within, and neither rainfall picture includes storm surge, which matters on this coast. There are no damage-frequency curves here and no expected annual damage. NHESS publishes the referee reports beside the paper, and the analysis code and all the rainfall fields are posted on Zenodo, so both the review and the comparison can be checked.
The direction has independent support. In a coastal North Carolina watershed, John A. Baer and colleagues compared design storms with the same repositioning method and found the design storms underestimated expected annual damage by 93%, in a study published in June 2026. Different team, different basin, different model. The building count in Louisiana belongs to Louisiana.