Mapping a Cyclone's Reach Without Waiting for the Clouds to Clear

A cyclone leaves the Bay of Bengal coast under cloud. The sky over Khulna or Patuakhali can stay shut for days after landfall, and that is exactly the week when someone in Dhaka needs to know which embankments went, which villages are under water, and where to send the first assessment teams. An optical satellite, in that week, returns a photograph of weather.
So a team at the University of Dhaka went looking into a property of radar that rarely leaves the technical literature: how well two radar passes over the same patch of ground still agree with each other. Shadmin Islam Prova and colleagues published their result on Oct. 19, 2026, in Natural Hazards and Earth System Sciences, a European Geosciences Union journal that posts its referee reports in public beside the paper.
Radar does not photograph a surface. It listens for its own signal coming back. Send the same pulse from the same orbit twice and, if nothing on the ground has shifted, the two returns line up, wave for wave. Interferometric coherence is the name for how closely they still match, one pass against the next. Strip the leaves off a tree, flatten a tin roof, push a meter of saltwater across a rice field, and the match falls apart. None of that is new. Coherence loss has worked as a stand-in for damage since 2011, when NASA's Jet Propulsion Laboratory began issuing damage proxy maps after the Christchurch and Tohoku-oki earthquakes, and the paper cites a decade of work behind it.
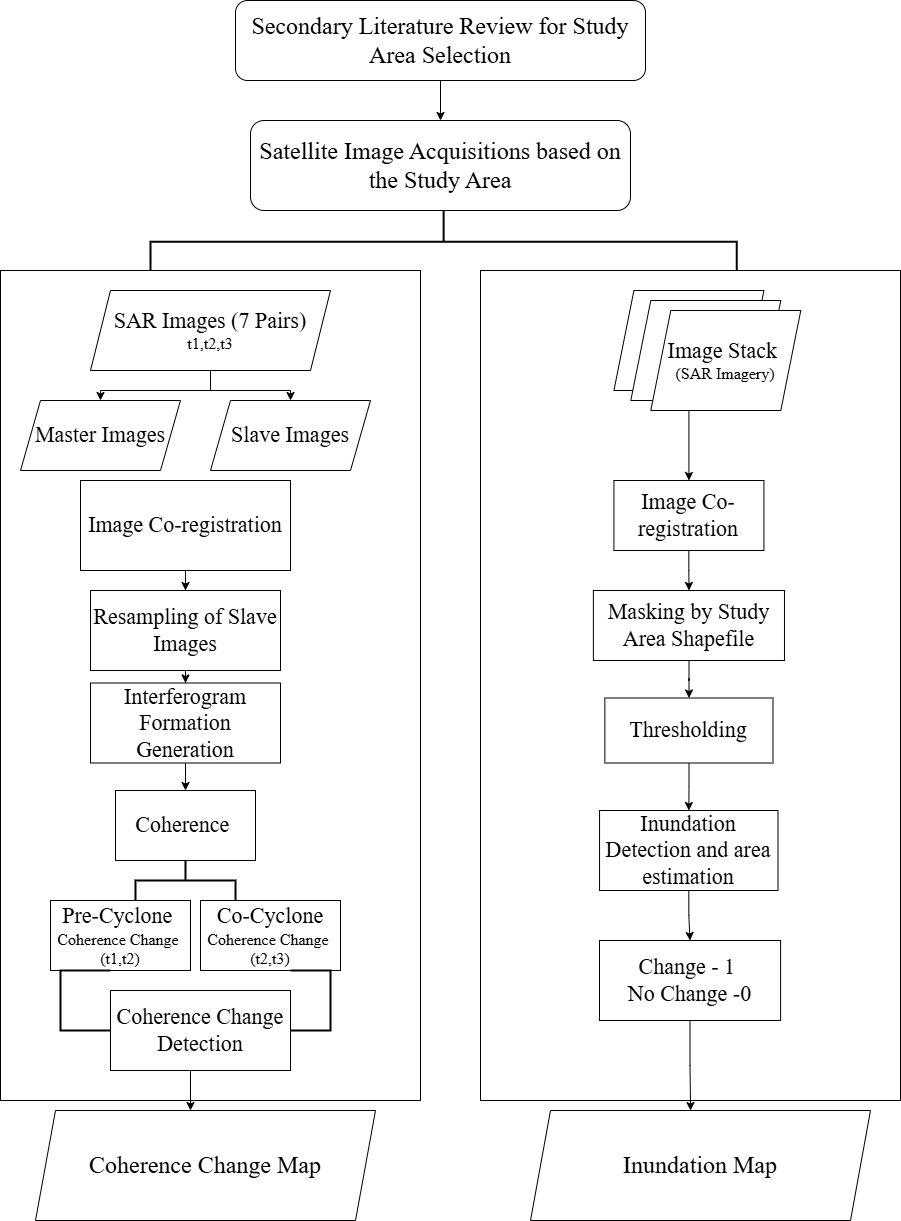
What this team did differently was stack the passes instead of pairing them. They took five cyclones between 2020 and 2024: Amphan, Sitrang, Mocha, Hamoon and Remal. For each one they pulled several Sentinel-1 images from before the storm, to learn how much coherence drifts in that landscape on its own, then one pair spanning the storm itself and more from the weeks after. A pixel counted as disturbed when its coherence fell further than the average fall across the whole scene. The cutoff is set per storm rather than fixed, because coherence on this coast is low even in calm weather. A yardstick built from a scene's own average will always flag part of that scene. The coverage runs across seven coastal districts: Khulna, Satkhira, Barguna, Patuakhali, Bhola, Cox's Bazar and Chattogram, and the area analyzed inside them differs from storm to storm.
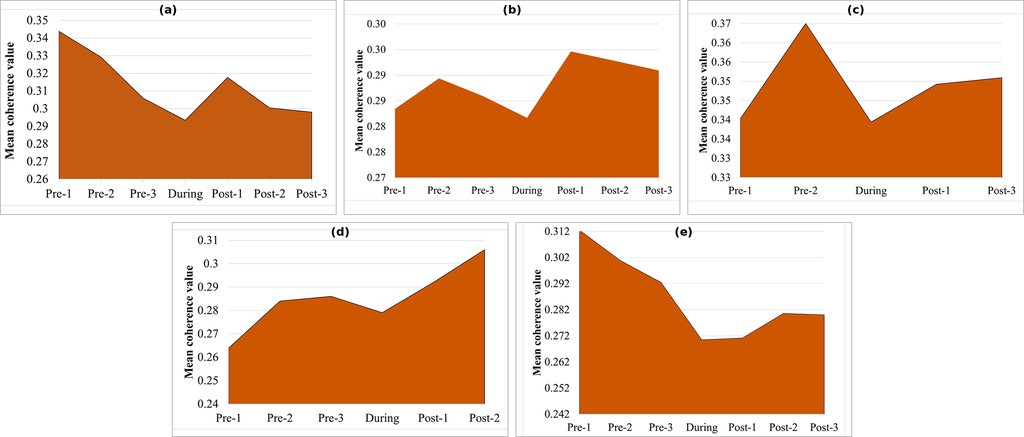
Scored that way, Cyclone Remal leaves the largest footprint of disturbance, about 601 square kilometers, followed by Mocha at roughly 474 and Amphan at 288. Sitrang and Hamoon both land near 120 km² and cannot be separated: the authors' own sensitivity test moves the mapped areas by about a seventh to a quarter when the cutoff is shifted by a tenth, and it names those two as the most sensitive of the five. The paper writes each of those numbers as an approximation, and each covers a different stretch of coast, so they are five separate estimates rather than a ranking. One detail in the paper is wrong: it puts Mocha's landfall in southern Cox's Bazar. Mocha came ashore in Myanmar's Rakhine State, near Sittwe, in May 2023, with the Bangladeshi coast on the storm's northern flank.
Where the Signal Reaches Past the Flood Line
The most useful number in this paper is not the 94% on its cover. It is a comparison the referees asked for during review. The team also mapped flood extent separately, from the same satellite's radar brightness, then asked how the two layers overlap. Inside the flooded area, 79% of pixels came out as disturbed. Outside it, 45% did. Flooding clearly drives much of the coherence loss, and the pixels outside the flood line are the authors' case that this method sees what a flood map misses: snapped trees, stripped roofs, sand pushed across fields.
It is also where a skeptical reader would put the vegetation. C-band radar like Sentinel-1's loses coherence over growing plants all on its own, closely enough that other groups use the measurement as a vegetation index, and JPL's guidance on its own damage proxy maps warns that they are less reliable over vegetated ground. Coastal Bangladesh is a vegetated delta. The paper does not rule that reading out, and it does not claim to have measured destruction: the authors write that coherence loss "should not be interpreted singularly as a proxy for flooding," and the published text renames the product to match, as coherence-derived surface disturbance.
One Storm Checked on the Ground, Four Checked on Paper
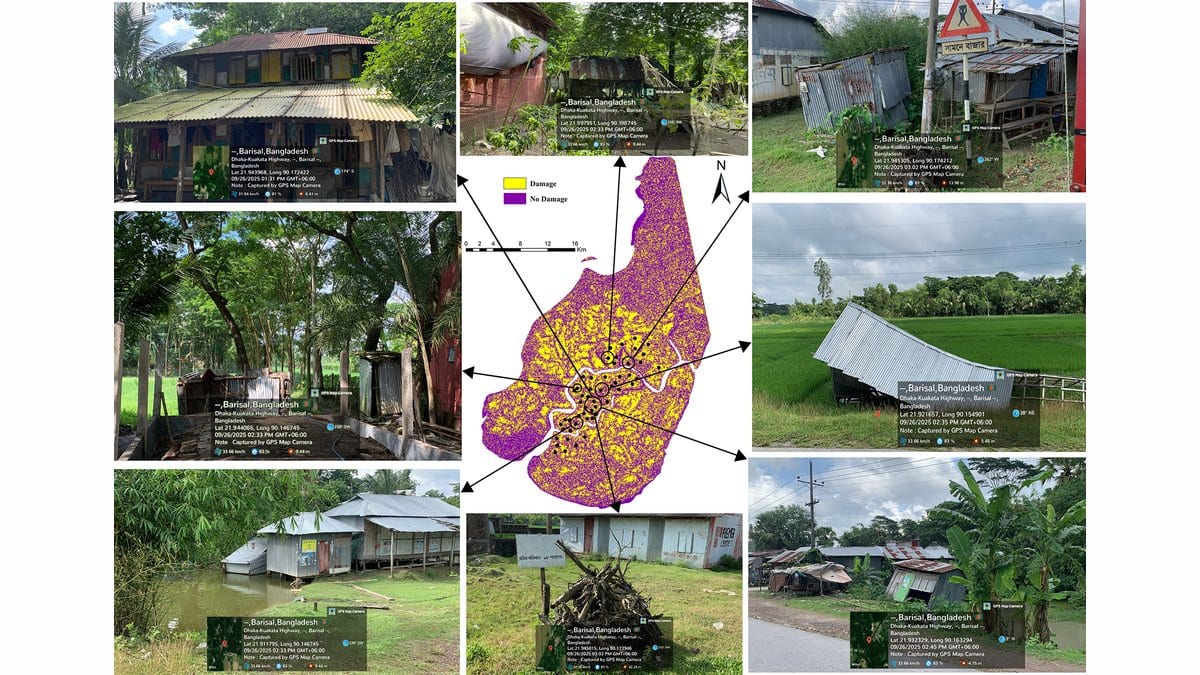
The paper is plain about where that figure comes from. Field verification was carried out only for Cyclone Remal, because that was the only storm recent enough for site visits. For Sitrang, Amphan, Mocha and Hamoon the check was made against secondary datasets, and no accuracy figure is reported for any of those four. The Remal check rests on 50 points, visited with GPS and photographed. The visit came about a year after the storm, which the authors flag themselves: surfaces change in a year, and a flooded paddy field is one of the ones that changes most. Those reference points were also picked out by eye from the radar imagery first and cross-checked against local damage information afterward, so the answer key was drawn partly from the thing it grades. One of the paper's referees said in the journal's public review that the validation is not adequately reported, and it stands in the published version.
Those 50 points are also the one part of this work an outsider cannot inspect. The processing code is deposited at Zenodo and the Sentinel-1 images are free, so the maps themselves can be rebuilt. The validation data, the authors write, are available from the corresponding author on reasonable request.
The 48-Hour Product This Study Did Not Run
What the team wants next is stated openly, as a recommendation rather than a result. The paper calls the framework operationally effective and sees strong potential for near-real-time disaster response. Its closing section proposes folding the workflow into a central government disaster data system, or into the dashboards of Bangladesh's humanitarian coordination group, so that damage forms, joint needs assessments and post-disaster needs assessments can be fed within 48 to 72 hours of landfall. None of that was tried here. Every map in the study was made years after the storm it describes, and no processing time was measured. None of it is a forecast either: the first useful image comes after the cyclone has passed.
The authors are equally clear that their cutoff will not travel. Thresholds set on this coast may not apply elsewhere, they write, and another region would need its own baseline, its own threshold and independent validation. The same condition sits closer to home. What would turn a retrospective study into something a response officer could open on the second morning after landfall is a reference set collected at the time, by people other than the ones who drew the map, and that is the piece still missing.