The Rain Band That Floods Southern Africa Is Projected to Swing South More Often

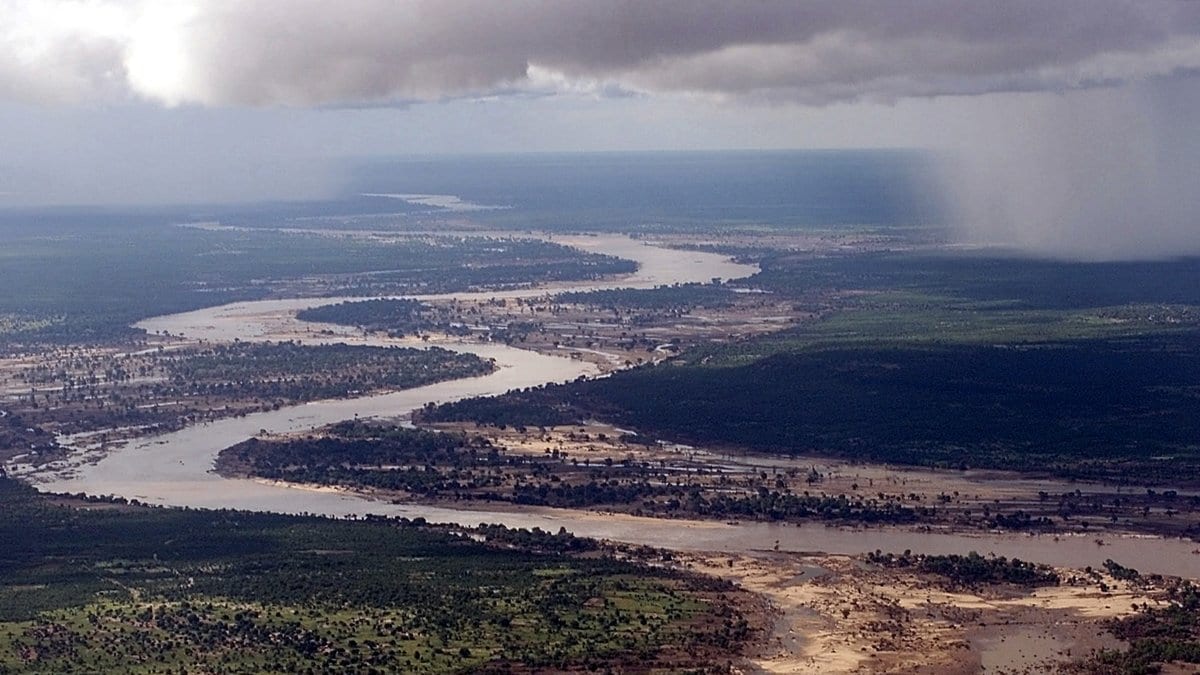
Southern Africa takes most of its rain between December and February, and it arrives in a band. A long lane of cloud and thunderstorms lies diagonally across the subcontinent, running from the tropical interior out toward the southwest Indian Ocean, and where it sits decides which catchments fill. In some summers it slides south of its usual place. The rain then falls on ground that is not used to it, rivers come up quickly, and the season reaches the outside world as a flood.
Meteorologists call that lane the South Indian convergence zone, and a paper published Oct. 20, 2026, in Nature Climate Change asks what greenhouse warming does to its southward lurches. Haodong Wang of the Ocean University of China in Qingdao, Wenju Cai and colleagues put the question to the current generation of climate models. Under a high-emissions pathway, the one labeled SSP5-8.5, the extreme swings come about twice as often: one event per 22 years in a simulated twentieth century, one per 10 years in a simulated twenty-first. On the same pathway, the rain falling during those events is on average about 20% more intense. "Doubles" is the authors' own word for it, and if anything it rounds down.
The one-in-22 is worth pausing on, because it is not a tally of real floods. It is the rate the models themselves produce when run across 1900 to 1999, set against the rate the same models produce across the century that follows. The past this doubling is measured from is a modeled past.
The observed record is thinner, and the authors do not hide it. In the weather record they use, which begins in 1960, exactly four summers count as extreme southward swings: 1998/99, 1999/2000, 2016/17 and 2020/21. Four events are far too few to measure a trend in, and the paper does not ask them to. They do three other jobs. They show that an index built from rainfall tracks where the band actually sat, tested against seven milder swings as well. They give the shape of an event: in each of the four, the maps show rainfall displaced south of its usual position, with the low-level winds that went with it. And they identify the mechanism. Accounting for where the extra water came from, the team finds the swings are carried by winds moving moisture that is already there, not by warmer air holding more.
Why the models do this comes down to two slow changes in the background, each of them familiar on its own. Land warms faster than ocean, so as the African continent pulls ahead of the Indian Ocean beside it, the pressure difference between them grows and the low-level wind over the band's latitudes blows harder from the north. That pushes the band south. Separately, the belt of westerly winds circling the Southern Ocean is shifting toward the pole, which in the models warms the subtropical Indian Ocean more on its southern flank and turns the winds over the southeastern Atlantic, pulling moisture off that ocean and across Africa. Both changes favor a southward swing.
Both legs are inferred by comparing models with each other, not by switching a mechanism off in an experiment: the models with the larger background change tend to be the ones with the larger increase in swings. The team ran down two obvious alternatives as well, changes in El Niño behavior and changes in a temperature seesaw in the south Indian Ocean, and found that neither accounts for the increase.
The headline figures come from a screened set: the 20 of 43 CMIP6 models selected for how well each one reproduces the observed rain band, its mean position and its north-south swings. Narrowing an ensemble that way is ordinary practice and the paper declares it, then tests whether it matters. When run with the screening dropped, and run again under three lower-emissions pathways, the direction of the change survives: more southward swings under warming. What belongs to SSP5-8.5 is the size of the increase, not its sign.
One thing the 20% does not mean. It is the average intensity of the swing events themselves, the models' twenty-first century against their twentieth, under SSP5-8.5. It is not a projection that southern Africa gets wetter. The paper's own maps have the band's average position moving north, away from much of the region. An independent survey of the same model archive, published in July 2024, points the same way for the regional average: Bobde and colleagues find that southern Africa and Madagascar "tend toward future drying," and project very dry years there about twice as often by the end of the century. Together the two make a sharper picture than either alone. The typical season is not projected to get wetter. The wet extremes are projected to come more often, and to carry more rain when they come.
On floods the paper stops well short of a forecast, and the hedging is its own. The authors write that more frequent southward migration of the band "might thus indicate increasing flooding risk in parts of southern Africa": might, indicate, in parts of. The study models rainfall and nothing downstream of it. Drainage, dams and where people live are not in it. What is in it, posted openly, is the code behind the figures and the swing indices from the selected models, which is roughly what a hydrologist would need to take the next step.