2026’s Potential Super El Niño: What We Know — and What We Still Don’t Understand

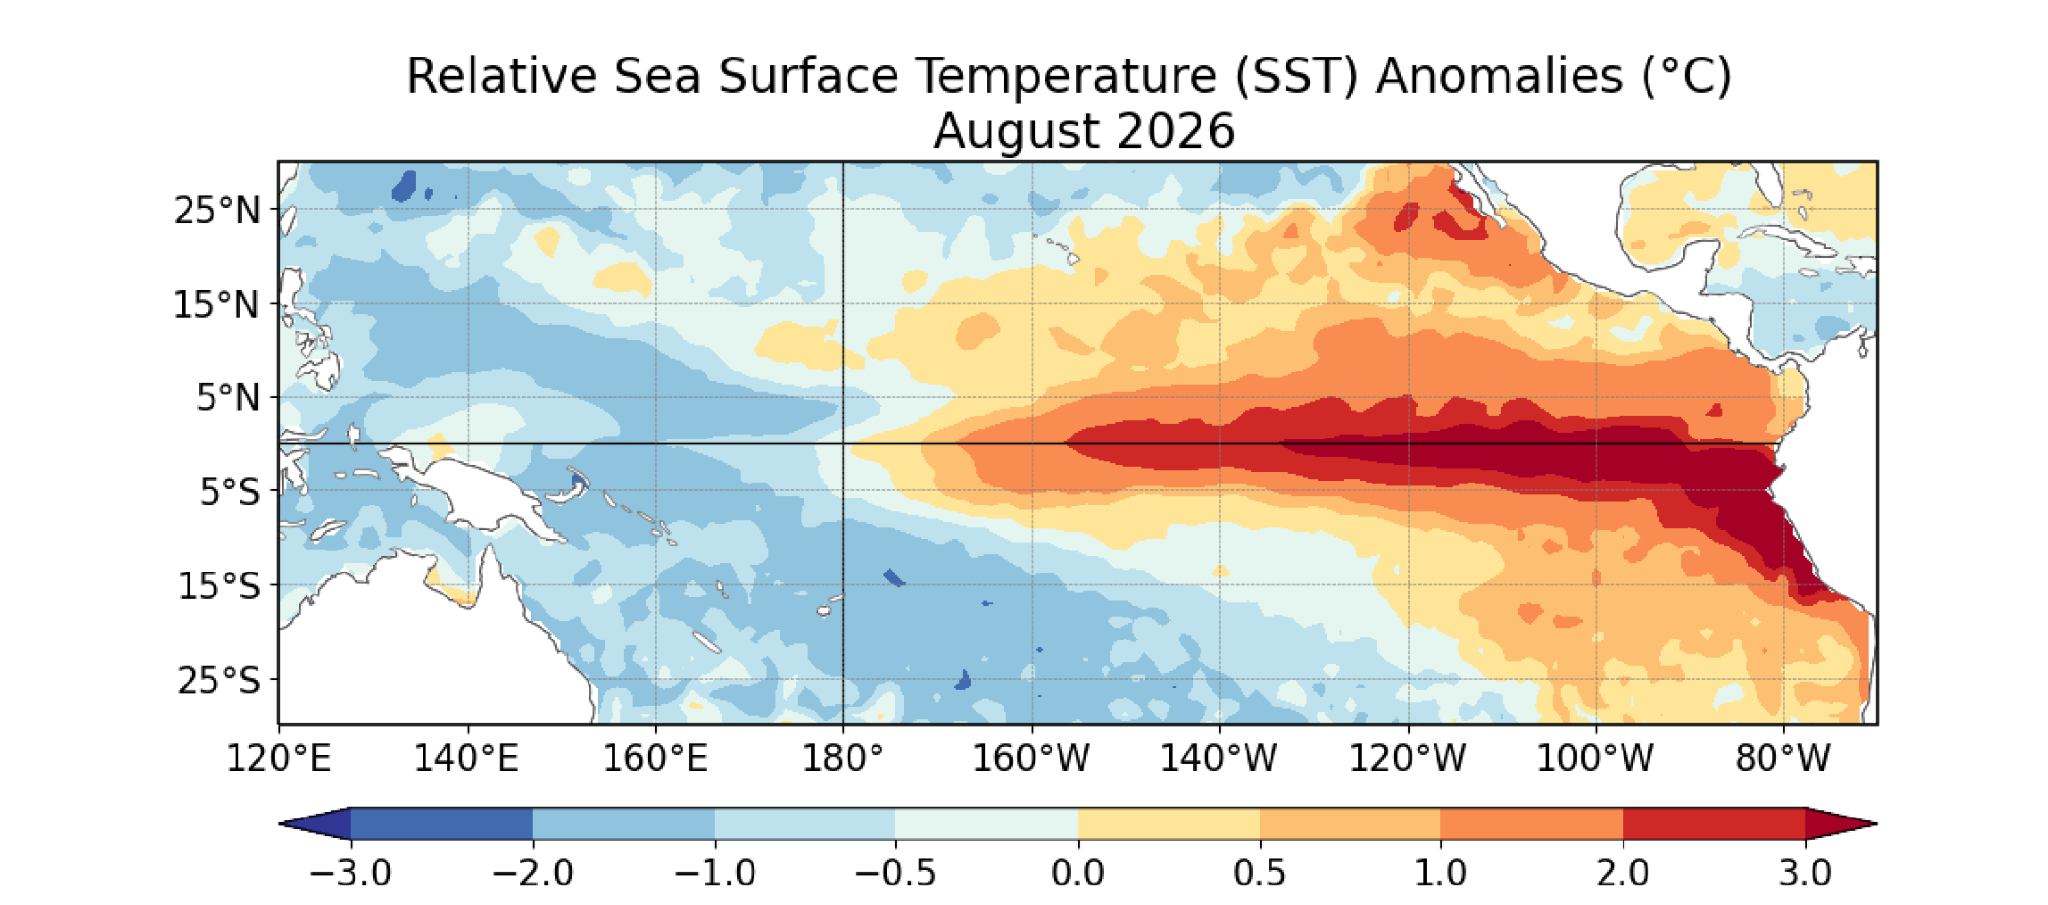
El Niño, the periodic warming of the tropical Pacific that reshapes weather around the world, may be about to reach a strength never recorded. Only months ago the ocean was in the opposite state: in February 2026, La Niña, the cool phase of the same natural cycle, still held the tropical Pacific. In March, NOAA expected conditions to move toward neutral and gave only about a one-in-three chance that an El Niño developing later in the year would become strong by October–December. By September 10, the situation looked completely different. NOAA was reporting a greater than 90 percent chance of a very strong El Niño this winter and a 75 percent chance that it would exceed every El Niño on record since 1950. Sea-surface temperatures in the far eastern Pacific were already more than 3°C above normal, while unusually warm water below the surface showed anomalies exceeding +10°C, Fig. 1.
How did the Pacific change so quickly, and what could an unusually strong El Niño mean for a planet already experiencing near-record ocean and atmospheric temperatures?
How El Niño works and what the numbers mean
El Niño is the warm phase of the El Niño-Southern Oscillation, or ENSO, a natural interaction between the tropical Pacific Ocean and the atmosphere. Under normal conditions, trade winds — persistent tropical winds that blow mainly from east to west along the equator — push warm surface water westward toward Indonesia and the western Pacific. As this water moves west, colder water rises from deeper layers near Peru and Ecuador to replace it. This process, called upwelling, brings cold, nutrient-rich water toward the surface and supports some of the world's most productive fisheries.
As warm water accumulates in the western Pacific, the thermocline, the boundary between warm surface water and colder deep water, becomes deeper in the west and shallower in the east. During El Niño, the trade winds weaken and can sometimes briefly reverse. Warm water spreads back toward the central and eastern Pacific, the thermocline becomes deeper in the east, and the normal upwelling of cold water is suppressed. The atmosphere responds to this redistribution of heat: tropical rainfall moves eastward, pressure patterns change, and jet streams shift. Through these long-distance connections, changes that begin in the tropical Pacific can eventually influence weather thousands of kilometers away.
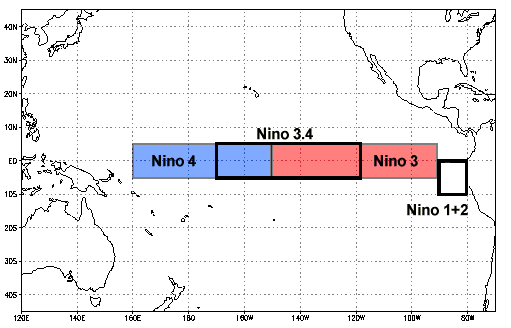
When we hear that El Niño has reached "+1.8°C" or "+2°C," however, this does not mean that the whole Pacific Ocean has warmed by that amount. Scientists monitor several specific areas of the equatorial Pacific known as Niño regions.
The most important is Niño 3.4, an area of the east-central equatorial Pacific extending from 5°N to 5°S and 170°W to 120°W. It can be thought of as the main thermometer used to measure the overall strength of El Niño. Another important region, Niño 1+2, lies much farther east, directly west of Peru and Ecuador, between 0–10°S and 90–80°W, Fig. 2. Because it is close to the South American coast, Niño 1+2 can become much warmer than Niño 3.4 during some events.
There is one more detail that is important for understanding the 2026 numbers. In February 2026, NOAA changed the way it officially measures the strength of El Niño, switching to the Relative Oceanic Niño Index, or RONI.
Traditionally, scientists measured how much warmer or colder different Niño regions were compared with their historical averages. But today the tropical oceans as a whole are warmer than they were in the past. This means that part of the temperature anomaly measured in the Niño regions reflects the broader warming of the ocean, not El Niño alone.
The relative index accounts for this by subtracting the average temperature anomaly across the tropical oceans from the anomaly measured in each Niño region. In simple terms, it asks: how much warmer is the El Niño region than the tropical oceans around it? This helps NOAA separate the El Niño signal from the background warming of the tropics. For its official assessment of El Niño strength, NOAA uses the relative anomaly in Niño 3.4.
In August 2026, Niño 3.4 was about +2.5°C above its historical average, while its relative anomaly was about +1.8°C. Farther east, Niño 1+2 reached about +4.1°C above its historical average, or about +3.4°C using the relative measure. Both values are important. The traditional values show how extraordinarily warm these parts of the Pacific have become compared with the past, while the relative values show how much warmer each El Niño region is relative to the tropical oceans as a whole.
"Super El Niño" is not an official category. NOAA calls an El Niño with a Niño 3.4 anomaly of +2.0°C or higher (since 2026 measured by the relative index, RONI) "very strong," its highest strength category. Only a few events in the modern record have reached this level, including 1982–83, 1997–98 and 2015–16, Fig. 3.
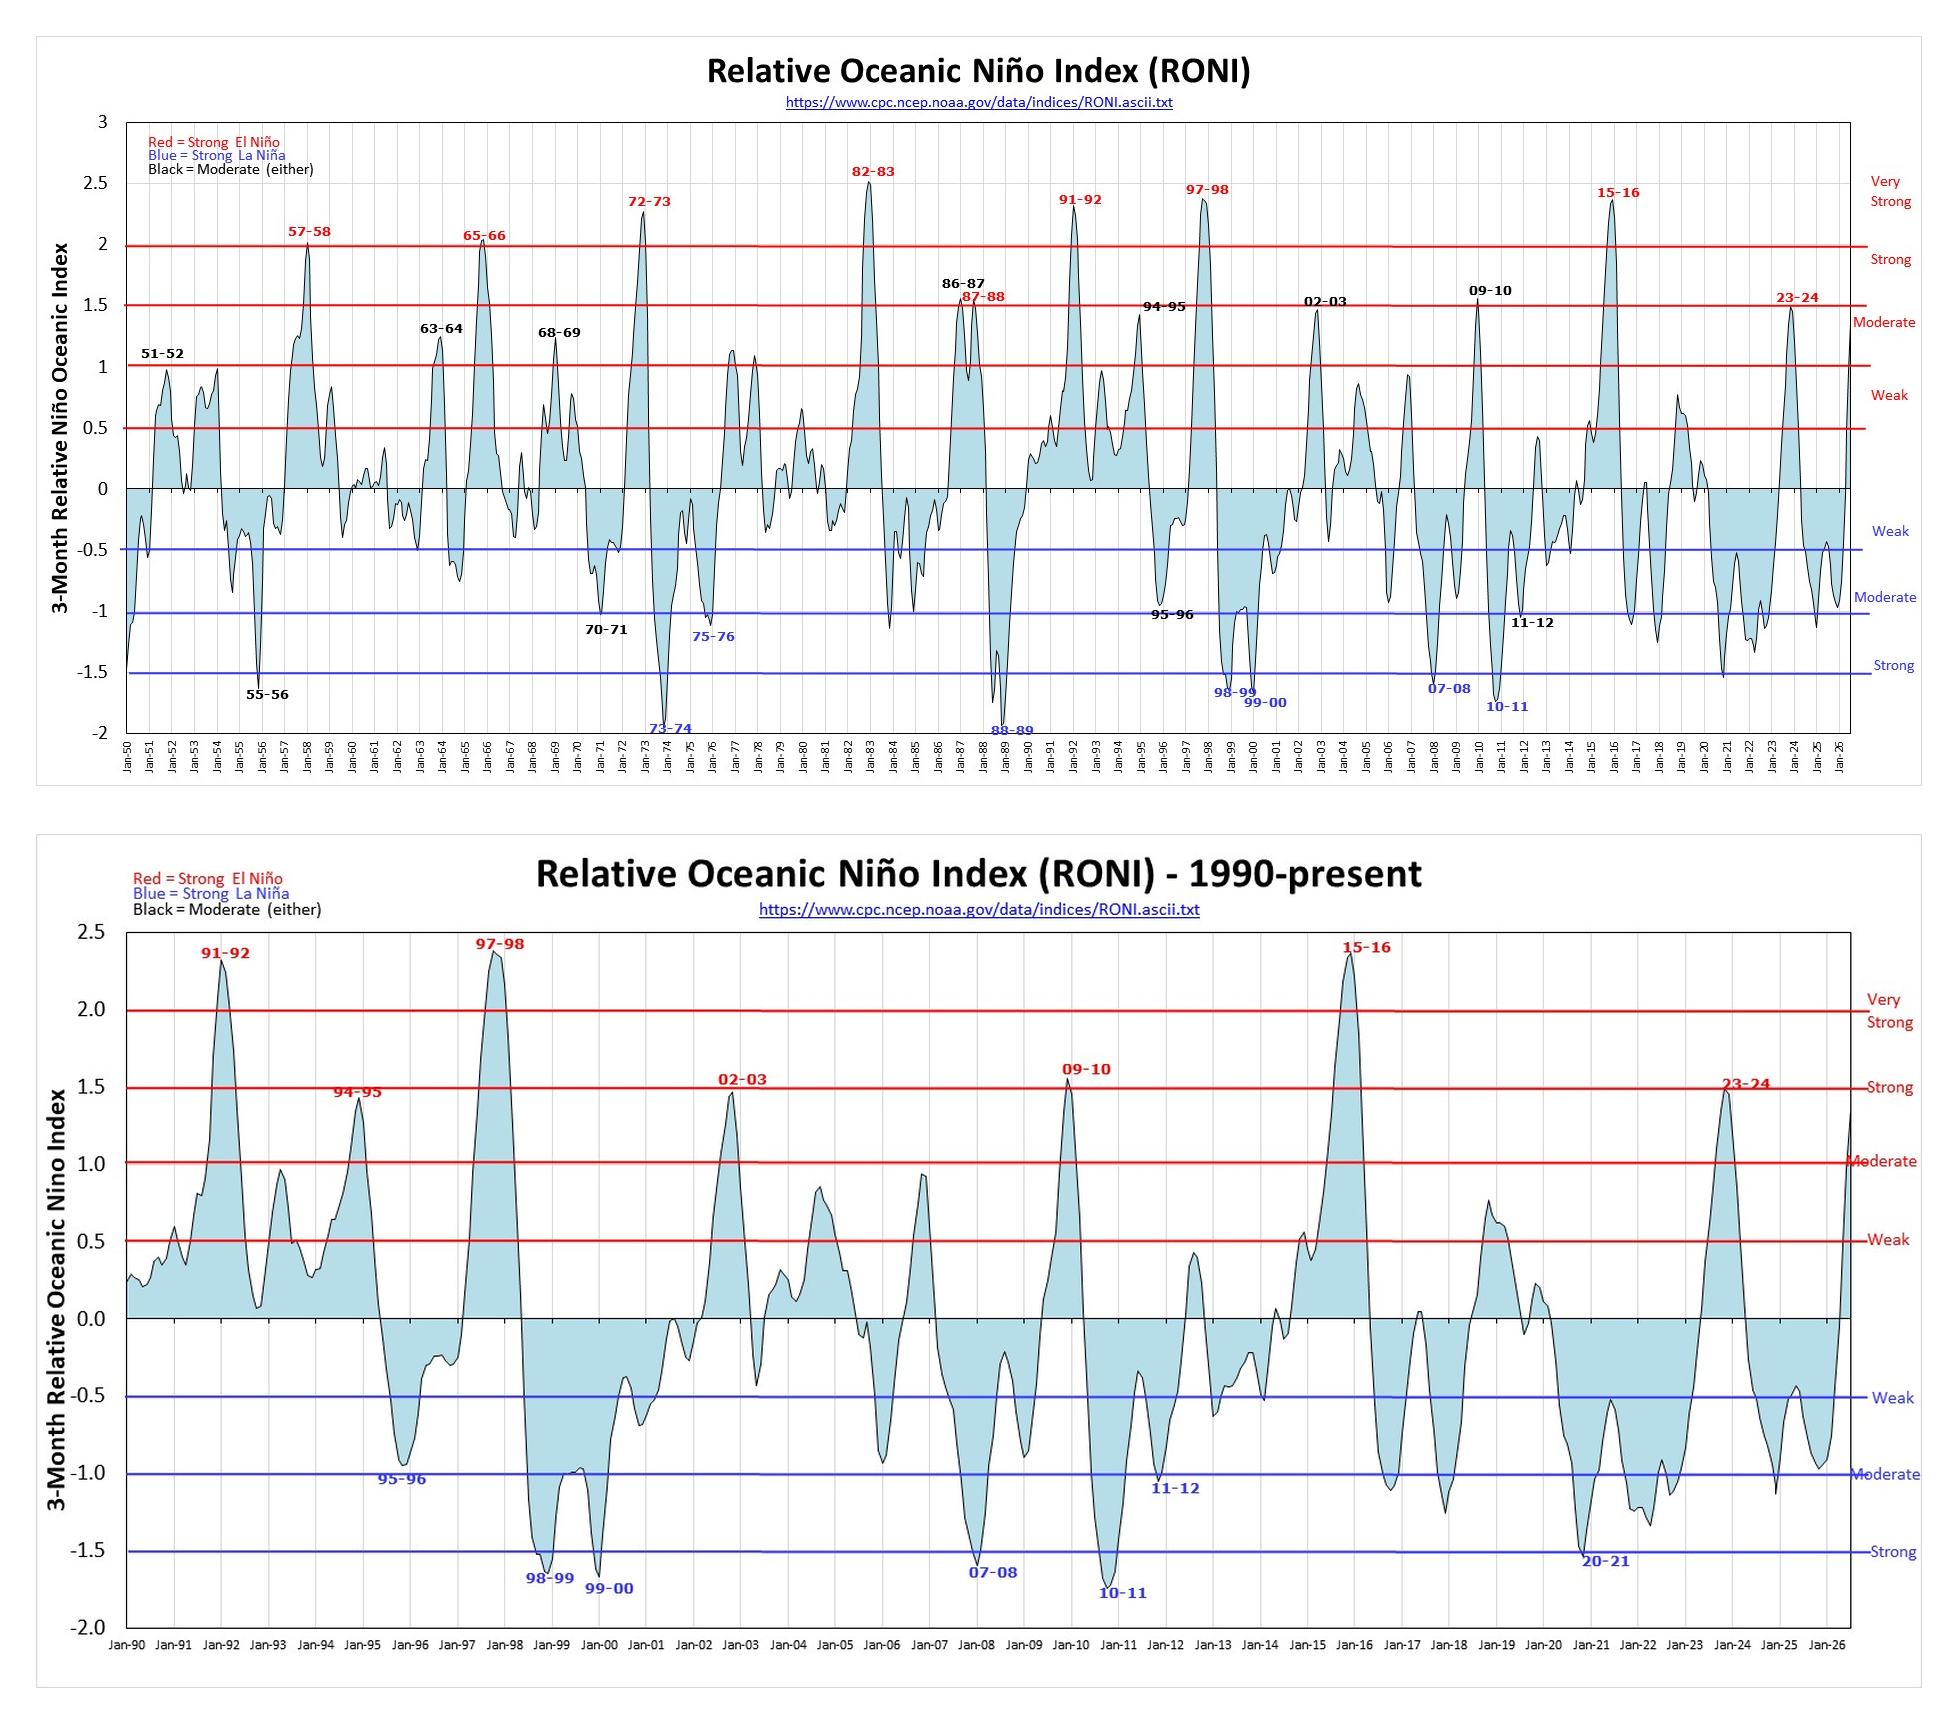
The +2 °C level matters because it represents exceptionally large warming across a huge area of the central tropical Pacific. That much extra ocean heat can produce a stronger shift in tropical rainfall and atmospheric circulation, increasing the risk of major droughts, floods, heat extremes and other weather disruptions around the world. It does not mean every region will experience extreme impacts, but events this strong have greater potential for widespread consequences.
Rapid shift of 2026
What is especially striking in 2026 is how quickly the Pacific approached this level. Niño 3.4 went from about −0.5°C in March, when La Niña was still present, to +1.8°C in August — a 2.3°C swing in only five months. Farther east, Niño 1+2 near Peru and Ecuador reached +3.4°C.
Much of this change was already developing below the surface. A large reservoir of warm water spread eastward through the equatorial Pacific, with subsurface anomalies approaching +10°C in some areas. As this heat moved toward the surface, El Niño strengthened rapidly.
El Niño usually peaks around the Northern Hemisphere winter, so the 2026 event may strengthen further. Its largest consequences may come later: changes in rainfall, drought, fires, marine ecosystems and global temperature can continue for months after the ocean itself reaches its peak.
Those effects are also not distributed evenly around the world. El Niño essentially redistributes heat and moisture. Historically, depending on the season, it increases the risk of drought in parts of Indonesia, Australia, southern Africa, Central America and northern South America, while increasing the likelihood of wetter conditions in coastal Peru and Ecuador, parts of East Africa and the southern United States.
The ocean itself is affected directly. When upwelling off Peru weakens, fewer nutrients reach surface waters, potentially disrupting marine ecosystems and fisheries. Strong El Niño events can also intensify marine heat stress and contribute to coral bleaching. Agriculture, water resources, wildfires and food security can therefore all be affected.
But this El Niño is developing under different background conditions than similar events decades ago. The planet and the ocean are already much warmer. And this leads to another question that became especially interesting after the extraordinary global temperatures of 2023.
In 2024, Dr. Gavin Schmidt, director of NASA's Goddard Institute for Space Studies, wrote in Nature that the extraordinary warmth of 2023 was about 0.2°C greater than expected after accounting for the known factors scientists had considered. The timing was particularly interesting because much of the exceptional warmth appeared before the 2023–24 El Niño had fully developed.
Scientists examined several possible contributors. Greenhouse gases continued increasing, but Schmidt estimated that their increase since 2022 accounted for only about 0.02°C of additional warming. Solar activity was considered. So were reduced sulfur emissions from shipping, which allow more sunlight to reach the ocean, and the unusual 2022 Hunga Tonga eruption. But these factors did not explain the entire anomaly.
Why was that particular year so much warmer than expected?
Schmidt described it as a knowledge gap requiring better observations and data. And that gap becomes interesting again as another exceptionally strong El Niño develops in 2026. If global temperatures again behave differently from what models predict, it will be important to understand why rather than simply assume that every part of the anomaly has already been explained.
One area that has received much less attention is heat entering the ocean from below.
Earth continuously releases geothermal heat through the seafloor, particularly around mid-ocean ridges, volcanic regions and hydrothermal systems. This heat source is real and measurable. Peer-reviewed studies show that it can affect deep-ocean circulation. Emile-Geay and Madec found that including geothermal heating in an ocean model could strengthen Antarctic Bottom Water circulation by roughly 15 percent under their modeled conditions. Hofmann and Morales Maqueda also found that geothermal heat flux influences abyssal temperatures, circulation and radiocarbon distribution.
This does not show that geothermal heat drives El Niño. These studies concern deep-ocean circulation and much longer timescales. The established explanation for El Niño remains the interaction among trade winds, ocean currents, thermocline depth, equatorial waves and atmospheric feedbacks.
But the idea that geological heat could contribute something to El Niño is not entirely new.
In 1988, USGS geologists Herbert Shaw and James Moore published a paper in Eos, the journal of the American Geophysical Union, examining a possible relationship between magmatic heat and the El Niño cycle. They calculated that known rates of mid-ocean magma production could potentially generate thermal anomalies as large as about 10 percent of the average El Niño sea-surface anomaly and suggested that larger episodes of volcanic activity along the East Pacific Rise might be associated with unusually intense events such as the 1982–83 El Niño. More recently, geologist James Kamis proposed a related, non-peer-reviewed hypothesis on his personal blog, suggesting that geological heating in the western Pacific could help "recharge" El Niño.
The ocean receives most of its heat from above through solar radiation and exchanges with the atmosphere, but it is also continuously heated from below. A simple way to visualize the question is a lava lamp: heating from below can create rising motion and reorganize circulation. The real ocean is obviously far more complicated, and geothermal energy contribution to ocean heat balance and surface and subsurface temperatures is not well understood.
Could localized changes in geothermal or hydrothermal activity ever be large enough to produce a measurable secondary influence on tropical Pacific heat transport? Answering that requires measurements — monitoring seafloor heat flux and hydrothermal activity together with deep-ocean temperatures, currents, subsurface heat transport and atmospheric changes across multiple ENSO cycles.
The 2026 El Niño may provide a particularly interesting opportunity to do this. If the event reaches the extreme strength now forecast, scientists can compare what actually happens with what existing models predict: how quickly heat moves through the Pacific, how the atmosphere responds, how global temperature changes and how long those effects persist.
We already understand a great deal about El Niño. But extreme events are also useful because they push the climate system toward its limits and can make gaps in our understanding easier to see.
The most interesting question about the 2026 Super El Niño may therefore not be only how strong it becomes, but what it can teach us about the parts of the ocean-climate system that we still don't fully understand.
Sources
- NOAA Climate Prediction Center. ENSO Diagnostic Discussion, March 2026.
- NOAA Climate Prediction Center. ENSO Diagnostic Discussion, September 10, 2026.
- NOAA. Understanding El Niño & ENSO.
- UCAR Climate Data Guide. Niño SST Indices: Niño 1+2, 3, 3.4, 4, ONI and TNI.
- NOAA Climate Prediction Center. Official ENSO Strength Probabilities (RONI).
- NOAA Climate Prediction Center. ENSO Diagnostic Discussion, August 13, 2026.
- Schmidt, G. A. (2024). Climate models can’t explain 2023’s huge heat anomaly — we could be in uncharted territory. Nature, 627, 467.
- Emile-Geay, J. & Madec, G. (2009). Geothermal heating, diapycnal mixing and the abyssal circulation. Ocean Science, 5, 203–217.
- Hofmann, M. & Morales Maqueda, M. A. (2009). Geothermal heat flux and its influence on the oceanic abyssal circulation and radiocarbon distribution. Geophysical Research Letters, 36, L03603.
- Shaw, H. R. & Moore, J. G. (1988). Magmatic heat and the El Niño cycle. Eos, Transactions American Geophysical Union, 69(45), 1553–1565.
- Kamis, J. E. (2016, September 30). "How Geological Heating Refuels El Niño." Plate Climatology (blog).