Air Measurements Put Dutch, German and Italian Methane Above the National Reports

A national methane total is arithmetic before it is anything else. A country counts its dairy cattle, its landfills, its coal mines and the length of its gas network. It multiplies each by a factor for how much methane that activity is thought to release, adds the columns, and submits the result to the United Nations. The procedure is careful and it is reviewed, and the European versions of it are generally held to be among the best in the world. It also never involves measuring any actual air.
Shuai Sun, of Zhejiang University and Westlake University, Yuzhong Zhang of Westlake University and six colleagues have now done the measuring, five years of it at once. Their assessment, published Oct. 23, 2026, in Atmospheric Chemistry and Physics, takes methane readings collected over Europe between 2019 and 2023 and works back from them to the ground. Methane that leaves a Dutch field does not stay over the field. It mixes into the wind and drifts, so the question the team put to a weather model was the reverse of the usual one: given how the air moved, and how much methane it was carrying when it reached each instrument, how much must have been coming off the land below?
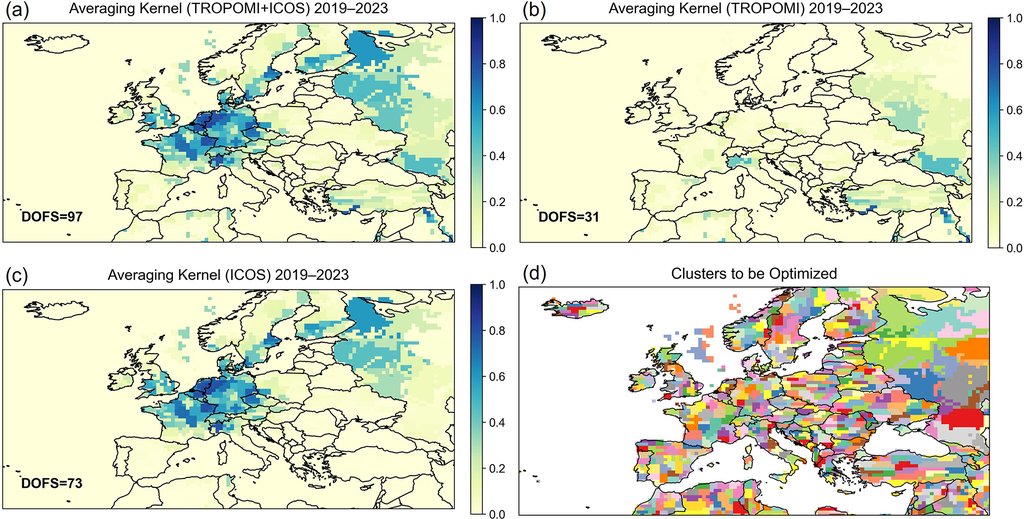
Two kinds of instrument fed the calculation. One is TROPOMI, which rides on a European satellite and reads the whole column of air beneath it. The other is a set of 28 ground stations in the Integrated Carbon Observation System, a European network of tall towers that sample the air hour by hour. The satellite sees almost everywhere, and each tower sees only its own patch, so the satellite might be expected to carry the result. It did not. Counted as independent pieces of information the measurements genuinely pin down, the towers on their own delivered 73 and the satellite on its own 31. Sun and his co-authors describe the satellite's contribution as the secondary one, useful mainly over the Iberian Peninsula and eastern Europe, where there are few towers.
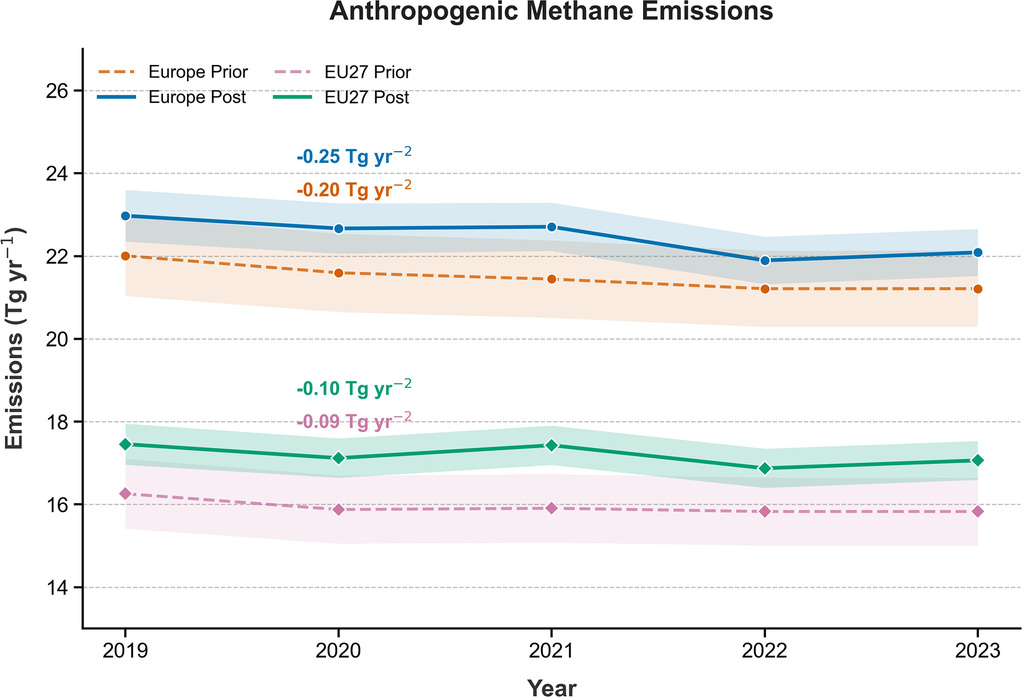
Averaged across the five years, the inversion puts Europe's methane from human activity at 22.5 million metric tons a year. That is about a million tons more than the bottom-up map the calculation started from, which is a research inventory rather than a set of national reports. The comparison with what countries actually submit to the United Nations is a separate exercise, and it comes out wider.
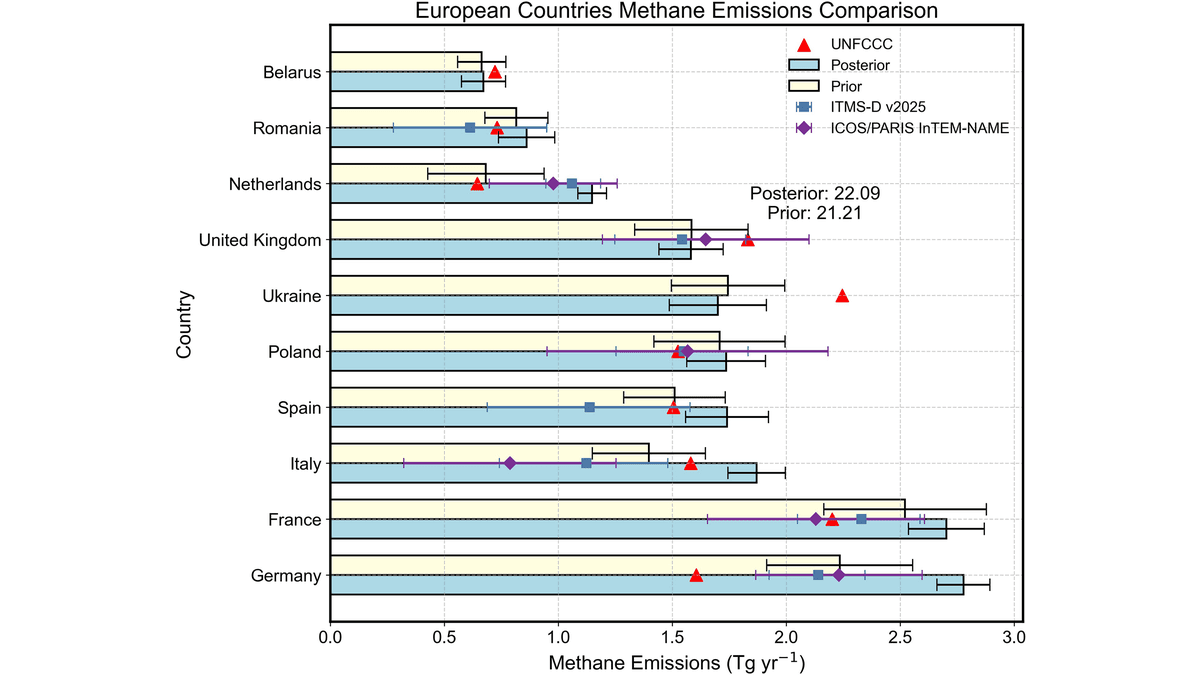
For 2023, the one year the team lined up country by country, the inferred totals for the Netherlands, Germany and Italy run 18% to 80% above the figures the three submitted to the UNFCCC. The Netherlands sits at the top of that range, with an inferred total close to double its reported one. Italy sits at the bottom, 18% above.
So where is the extra methane? The authors attribute most of the upward revision in all three countries to agriculture, and they are plain about how that attribution is reached. The measurements constrain how much methane leaves a patch of ground, not which activity on that patch released it, so the inferred total in each grid square is divided among sectors using the proportions already written into the starting inventory. The supporting evidence is circumstantial and consistent: a survey of Dutch dairy farms found whole-farm methane about 27% above the national inventory's own estimates, while measurement campaigns in Berlin, Groningen, Utrecht, Rotterdam and Milan turned up no comparable gap in the cities, which is what lets the team rule urban sources out as the main cause.
The paper names two competing explanations of its own. Coastal wetlands and freshwater, left out of the starting map altogether, could account for part of the Dutch increase. In Italy the rival candidate is geology, since methane seeps out of the ground there on its own; one published estimate puts that source at roughly 2 million metric tons a year nationally, where this study's starting map allowed almost none, and the overlap is worst in exactly the northern plains where the farms are. Italy is the softer end of the headline range for a second reason too. A separate European inversion, published in the same journal on Sept. 1, 2026, using different models and no satellite data at all, agrees that the Netherlands and Germany come out high and puts Italy low.
The method does not only push numbers upward. Offshore oil and gas in the North Sea comes out roughly half below the starting estimate, and Europe's wetlands are trimmed as well.
Over the five years, the direction of travel is down. Europe's emissions from human activity fall by about a quarter of a million metric tons from one year to the next, a decline that sits just inside the conventional test for statistical significance and slips outside it when the EU27 is taken on its own. What is falling is landfill, coal and natural gas. The livestock trend is indistinguishable from flat, an awkward pairing with the sector the inversion says is being undercounted.
That tension is the reason to do the exercise at all. Under the Paris Agreement, a country reports its own emissions, and those reports are what progress against the EU Methane Strategy and the Global Methane Pledge will be judged on. An atmospheric estimate is one of the few ways to test a report from the outside, and the materials for it are public: the ICOS tower measurements are released openly, as are the satellite retrievals and the national submissions. The check is also unevenly available. The places where this inversion could say least about a country, Romania and Ukraine among them, are the places with almost no towers.