The Valley Under Denman Glacier Is Rougher Than the Maps Show

On Jan. 7, 2024, a field team on the surface of Denman Glacier in East Antarctica walked a line about 14 kilometers long and stopped nine times. At each stop they set an instrument on the snow and waited for it to settle. The instrument measures gravity, and what it was weighing was the rock underneath a glacier's worth of ice.
Nine readings in a single day is not much data. They are enough to change the accepted shape of the valley the team was standing on.
The work was published Oct. 2, 2026, in The Cryosphere by Mareen Lösing and Alan Aitken of the University of Western Australia, with colleagues at the University of Florida and CSIRO. It is a final revised paper, open access, after the journal's two-stage public review. What it delivers is not a map. It is 150 of them, each a different plausible floor for the same valley.
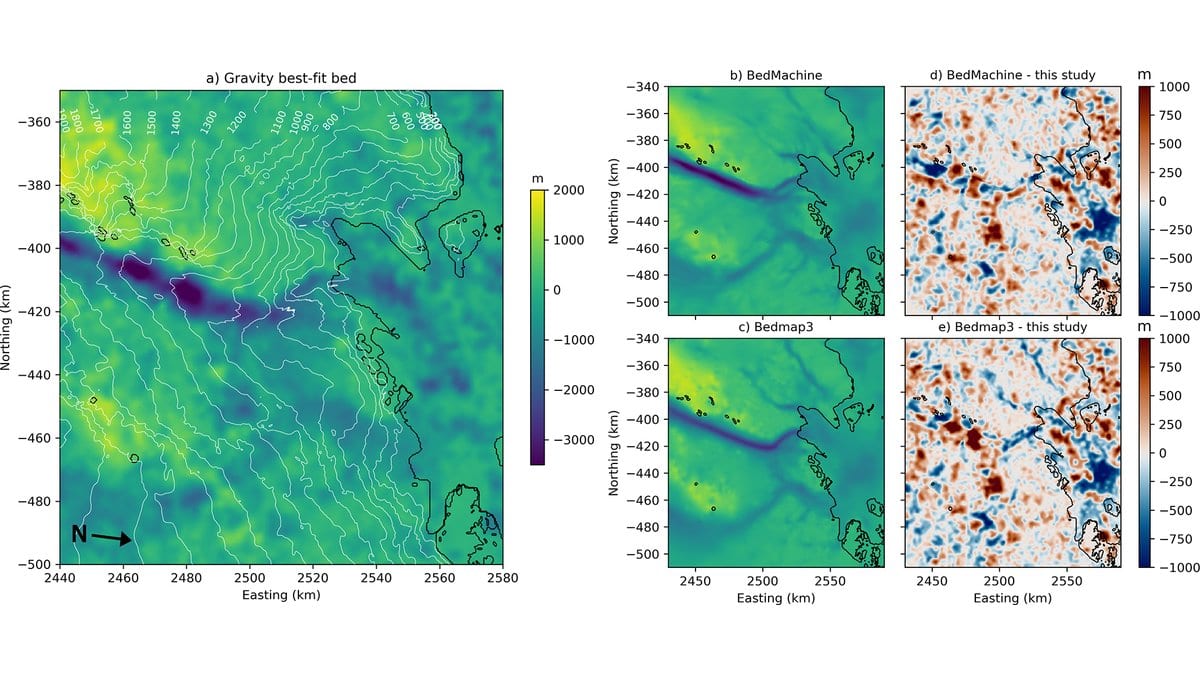
Denman matters because of where its floor sits. Most of the glacier rests on rock below sea level, which makes it sensitive to warm ocean water reaching the line where the ice lifts off the bed. The valley is also the one that current bed maps make the deepest on any continent. BedMachine, built by Morlighem and colleagues in 2020, puts its floor more than about 3.5 kilometers below sea level. That number was never sounded. It was worked out from how much ice the valley has to carry each year, and Lösing's team repeats it in the original's own hedged form: the trough is "modeled to host the deepest continental marine trough."
Radar cannot see the bottom of this valley
Radar is the normal way to find the floor under ice. A plane flies the line, a pulse goes down, and the echo off the rock comes back. Denman defeats it. The trough is deep, narrow and steep-walled, so returns arrive from the sides instead of from straight below. Crevasse fields scatter the pulse, and wet sediment and rough rock weaken the echo. Beneath the floating Shackleton Ice Shelf, where the valley carries on out to sea, there are no radar readings at all. The paper is careful to say this is the place, not the survey.
Between flight lines, often many kilometers apart, the bed has to be filled in, and each continent-wide product fills it differently. Bedmap3 follows the direction of ice flow between measurements. BedMachine works from the amount of ice moving through. Both return one answer, and both smooth.
Gravity works on a different principle and does not care how the ice is flowing. Rock is denser than ice, so a valley full of ice pulls less than solid ground would, and the pattern of that shortfall carries the shape of the hole. Airborne gravity has radar's problem in reverse: measured from the aircraft, and filtered as a moving platform requires, it keeps the broad picture and loses the fine detail. That is what nine stations on the snow put back. The authors' own verb for their contribution is "complements." The readings add fine detail along one 14-kilometer line to a decade of ICECAP airborne gravity, magnetic and radar data, with BedMachine as the starting bed.
A hundred and fifty beds, not one
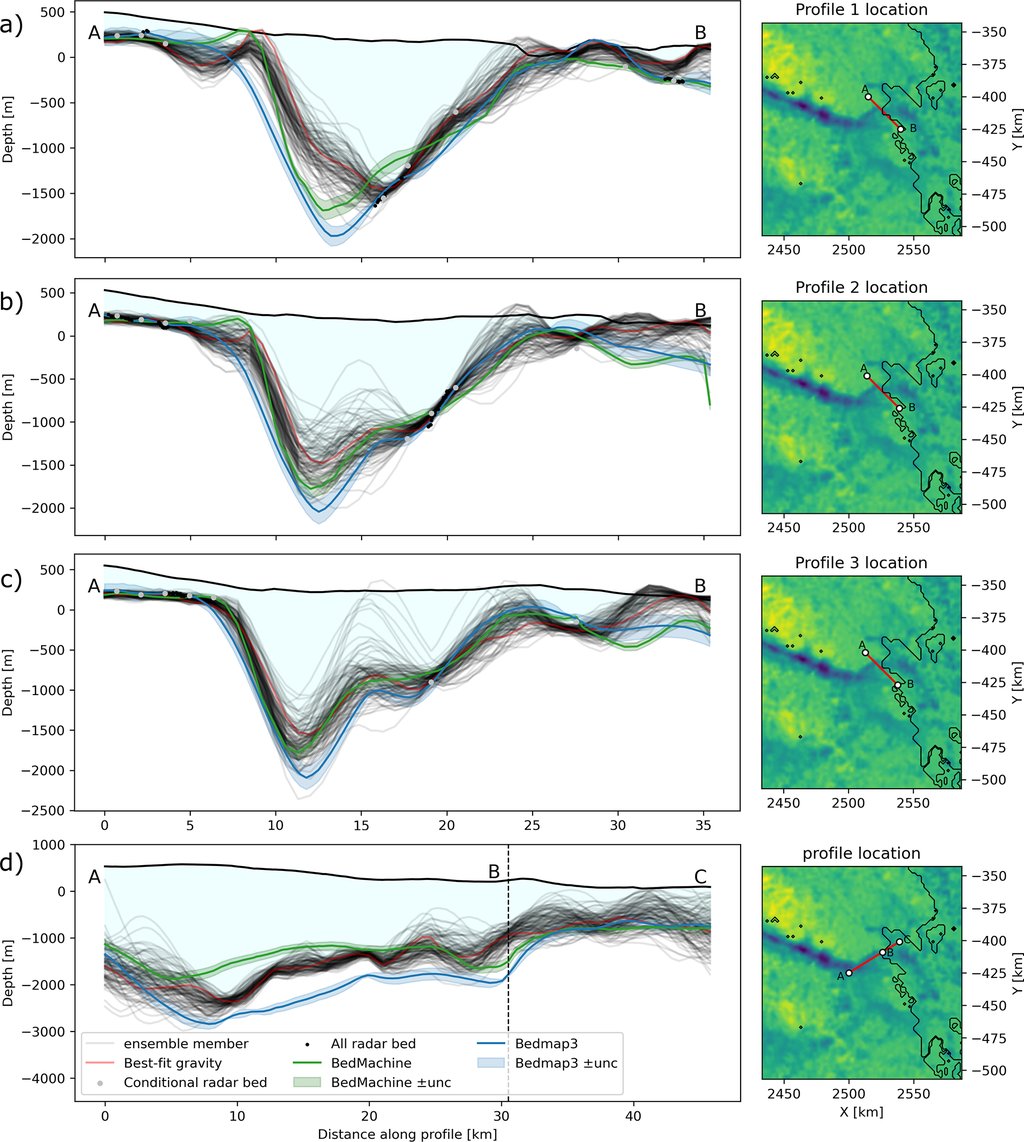
Because gravity is ambiguous, the team did not solve for a single bed. They first generated many plausible versions of the regional background field, the part of the signal that comes from deeper geology rather than from the valley. Each version then went into a random walk that nudged the bed thousands of times over, keeping the versions that fit both the gravity and the radar picks. The output was 150 accepted beds, most covering the wider region at coarser spacing and the rest resolving the ground line in finer detail.
Where radar pins the bed down, the 150 lines lie almost on top of one another. In the deep center of the trough, where there are no radar picks, they spread apart by 900 meters or more. The authors say what that means rather than leaving it to a figure caption: such local variations "should therefore not necessarily be interpreted as uniquely resolved topographic features," and in the trough "a unique depth solution is not expected."
They are as plain about the fit. The best models leave a mismatch about twice as large as the measurement error the team assumed, which the paper reads as either optimistic error estimates or real structure its simple model cannot hold. On that model, they write, the gravity low is "a composite response rather than a uniquely resolved basement surface."
The shape changed, not the depth
Across the profiles that cross the grounding zone, the best-fitting gravity bed sits between BedMachine and Bedmap3, and on the upstream ones it comes out "generally shallower than either." The depth is not what moved. The texture is. Instead of one smooth channel, the ensemble shows a rugged, compartmentalized floor with pockets of different depth, steeper side walls and more relief across the valley than either compilation carries. Near the grounding line it also hints at a low ridge splitting the trough into two connected basins, and at a channel running on beneath the ice shelf. Both of those sit in the least-constrained part of the model, and the authors call them potential rather than found.
Shape is what ice sheet models are sensitive to. If a grounding line retreats onto a bed that slopes downward inland, the ice there grows thicker, flow speeds up and the retreat can feed itself. Glaciologists call that marine ice sheet instability, or MISI. The gravity bed has exactly that inland slope, with steep flanks and little stabilizing high ground. The authors draw the line themselves: "the presence or absence of MISI cannot be inferred from geometry alone." Ridges across the trough could hold a grounding line for a time by adding drag, and once it passes them the retreat can resume.
What a Denman retreat would be worth is someone else's figure. If the glacier retreated irreversibly, Rignot and colleagues estimated in 2019, it could ultimately add up to about 1.5 meters to global sea level. This paper measures geometry and reports no ice loss of its own. The changes already on the record belong to other teams: flow in the grounded part is about 174% faster than half a century ago (Miles and colleagues, 2021), and the grounding line has pulled back more than 5 kilometers since 1996 (Brancato and colleagues, 2020).
The magnetic data suggest why the valley runs where it does. A steeply dipping line of magnetic sources sits under the middle of the surveyed line, marking a boundary between hard crystalline rock on the west side and softer sedimentary rock on the east. The trough, the authors propose, exploits that weakness.
The useful product is the ensemble itself, and it can be picked up: the field gravity and GPS data are published through the IMAS data portal, and the code behind the search is open on GitHub. For someone building an ice flow model, 150 beds that all fit the measurements are a more honest input than one map that looks settled. The spread is also a shopping list. The places where the 150 disagree most are where a longer ground profile, or a line of seismic or electrical soundings, would buy the most.