Sharper Climate Data Does Not Always Give a Better Answer

Everyone in climate-impact modeling has had the same instinct for years: a finer grid must give a better answer. Computing power got cheaper, climate data got sharper, and the boxes that data is built from shrank from tens of kilometers across to roughly the size of a village. The instinct is reasonable. It is also, a large new test finds, good only up to a point.
That check was published Oct. 9, 2026, in the peer-reviewed journal Environmental Research Letters. Johanna Malle of the University of Zurich and Dirk Karger of the Swiss Federal Institute for Forest, Snow and Landscape Research led it. Their colleagues come from the Inter-Sectoral Impact Model Intercomparison Project, which exists to run many impact models on common climate input. Together they took 16 impact models, drawn from several of the project's sectors, and ran them on the same climate data across a range of grid sizes. Karger's group also builds high-resolution climate data of the kind under test here, so the finding runs against its own interest.
An impact model is the second half of a climate projection. The first half says how hot and how wet a place becomes; the second says what that does to something people care about, and it is the half a decision-maker actually reads.
As the authors note, the assumption had "rarely been tested systematically across impact sectors, regions, and forcing variables." Their test compared four grid sizes: about 60 kilometers, about 10, about 3 and about 1. Most of the gain, both in the accuracy of the climate input and in how well the impact models performed, had already arrived by the 10-kilometer step. Refining further brought smaller and less consistent benefits, and in some cases degraded performance. In some runs the finer data left a model doing worse than the coarser data had.
That is not a measured cliff edge, and the paper does not claim one. Four rungs were tested, with nothing in between the two coarsest, so the experiment cannot say where in that gap the returns start to flatten. What it can say is that by the second rung most of the benefit was already in hand.
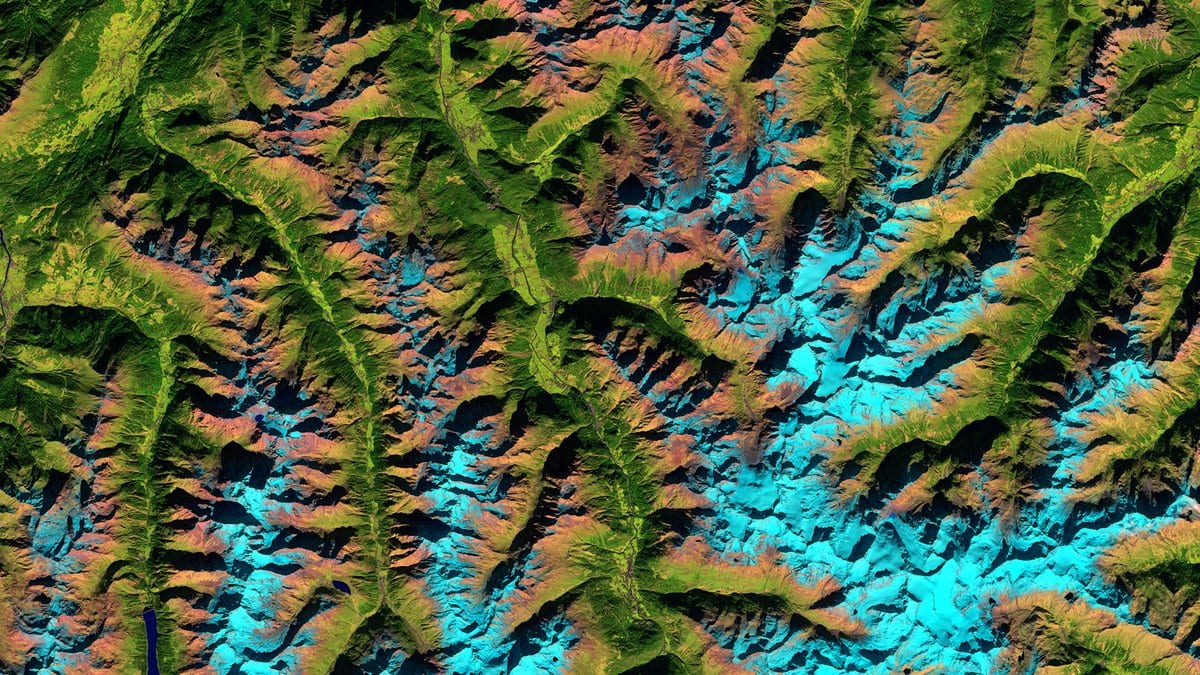
It also depends on what is being modeled. Improvements were strongest for models driven by temperature and in rugged terrain, where a finer grid captures the way conditions change over short distances. Models driven mainly by rainfall and regions with little relief gained less, and less predictably. The authors' conclusion is hedged in four ways at once: the value of resolution depends on which climate variable matters, on the sector, on the region, and on how the impact model represents the processes inside it.
A different group has already seen one half of this. Oakley Wagner, Verena Maleska and Laurens M. Bouwer compared a regional climate model at 12 kilometers with a 3-kilometer version of itself over a rural river basin in eastern Germany. Writing in Hydrology and Earth System Sciences on June 15, 2026, they reported that the finer run overestimated heavy rainfall badly enough to push river flow too high, and brought no added value for modeling the basin's water. Different models, a different country, the same direction of travel on rainfall.
Which leaves the question the paper ends on. Resolution has mostly been graded on how closely the climate input matches the weather that was actually observed, and that is a different exam from whether the impact model got its answer right. Grading it on the second, Malle and her colleagues argue, is what turns the choice of grid size into a question a research group can answer, instead of an assumption it inherits along with the computing bill.