The Tide Gauge Hiding in Forty Years of Satellite Beach Images

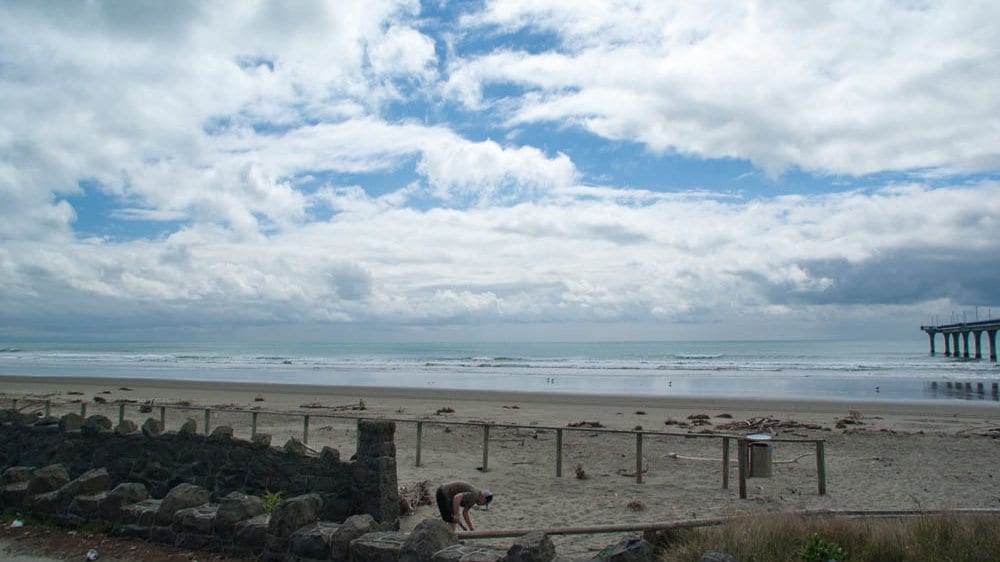
On any beach, the sea spends the day walking up the sand and back down again. To the people who use satellites to track eroding coastlines, that walk is a nuisance: before an image of a waterline can say anything about whether a beach is growing or shrinking, the tide has to be subtracted out of it. Michael Hart-Davis of the German Geodetic Research Institute at the Technical University of Munich, Thomas Monahan of the University of Oxford, and their colleagues decided to keep the part everyone else throws away.
Their paper, published August 25 in Communications Earth & Environment, uses the CoastSat shoreline archive: four decades of Landsat images of wave-dominated Pacific coastlines. For every cloud-free scene, software finds the water-sand boundary to better than a pixel and records where it crossed a set of survey lines spaced 100 meters apart along the shore. Multiply that horizontal position by the slope of the beach face and each waterline becomes a crude reading of sea level, taken at whatever moment the satellite happened to pass overhead.
The obvious objection is timing. Landsat returns to the same place every 16 days, while the tide it is being asked to measure turns over twice a day. What rescues the idea is aliasing: sample a fast, regular signal too slowly and it reappears as a slow one, at a frequency you can calculate. The principal lunar tide, M2 (the constituent behind the two highs and two lows most coasts see), falls out of just 191 days of Landsat passes, and the archives run far longer than that. The same orbit also takes some tides away for good. Because Landsat crosses the equator at a fixed local time, the solar tide is sampled at the same phase forever, and two other major constituents fold onto the annual cycle where they cannot be separated.
So how good are the numbers? Against tide gauges, the shoreline estimates get M2's amplitude wrong by 5.77 centimeters using classical harmonic analysis and 7.74 centimeters using a response method, on coasts where the tide itself runs well over a meter. The operational models the field relies on, FES2022 and GOT5.5, sit near 2.5 centimeters against those same gauges. The authors write it out plainly: their results "may not be as accurate as those from satellite altimetry in the open ocean or from tide gauges along the coast." What the method buys is not precision. It is reach, into a strip of water where the altimetry the models are built from stops about 3 kilometers offshore at best.
New Zealand is where they tested it hardest, because its tides are large and its tidal geography is strange. Inside Pegasus Bay, north of Christchurch, the M2 amplitude grows by about 5 centimeters from one end of the bay to the other. Within a single bay, in other words, the tide is close to uniform. The Cook Strait between the islands is the opposite case. There the tidal wave rotates around an amphidromic point, a pivot where the tide nearly vanishes. The shoreline data catches the timing swinging through 220 degrees along a 16-kilometer stretch of coast, a shift the gauges in the region confirm.
That contrast is the argument for the whole exercise. Tide gauges are spatially sparse, and only a small fraction of them sit in the Global South; by this study's count, the entire coast of South America is watched by nine gauges. Where there is no gauge, there is nothing independent to check a tide model against, and those models feed everything downstream, from navigation tables to the coastal flood maps that decide which streets sit inside a risk zone. Shoreline estimates are independent of both the gauges and the models. That is what makes a less precise measurement worth having: it can referee.
There are places the method is not ready to go. Turning a waterline into a water level uses a single beach slope, held fixed for the whole record, and beaches do not hold still. When the authors tried the obvious next question, whether the archive can show tides changing over the decades, they found trends orders of magnitude larger than those gauges and altimetry report. They read them as the beach moving rather than the tide. River mouths cause trouble too. At the Rakaia, on the Canterbury coast, the detected shoreline jumps in ways driven by the river, not the ocean.
And it is a Pacific Rim result, not a global one. The maps cover New Zealand, Hawaii, southern Japan, eastern Australia and the Pacific coasts of the Americas. Extending the archive to the Arctic and to the coasts of Africa, where in-situ measurements are scarcest, is something the authors argue for rather than something they have done. Anyone who wants to try it can: the shoreline dataset is public on Zenodo, the beach slopes are posted at coastsat.space, and the analysis code is on GitHub.
Sources
- Communications Earth & EnvironmentPeer-reviewed