Every IPCC Land Region Already Has Most of the Warming Expected at 1.5 °C of Global Warming

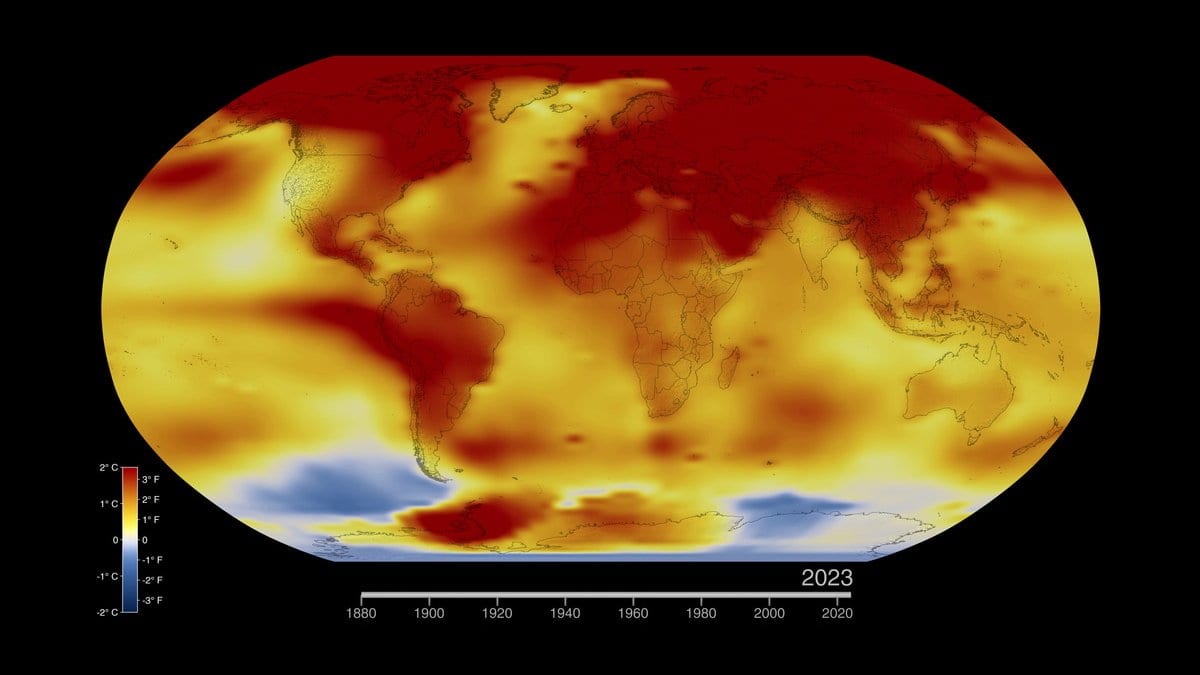
Nobody lives in a global average. The two numbers at the center of the Paris Agreement, 1.5 °C and 2 °C, describe the mean surface temperature of the whole planet, which is a quantity no thermometer anywhere reports. Land warms faster than ocean, and the far north faster still. So by the time the world as a whole crosses the lower of those limits, almost every place people live will be warmer than that by its own amount, and the question is how much of that local amount has already arrived.
Most of it, according to an analysis published Nov. 9, 2026, in Nature Climate Change. Tong Li, Francis W. Zwiers and colleagues at the Pacific Climate Impacts Consortium in Victoria, British Columbia, worked through all the land regions the IPCC uses to divide up the continents, and report that 90% to 94% of the warming a region should have when the global average reaches 1.5 °C has already happened there. Against the 2 °C mark, 65% to 76%.
That sentence is easy to turn into something the paper does not say. The percentage is a ratio of two temperatures in the same place: the human-caused warming a region had reached by 2025, divided by the warming projected for it when the global mean crosses the threshold. It is not a share of regions that have crossed 1.5 °C, and 46 is the count of regions, never the base of the percentage. Some northern regions did pass 1.5 °C of local warming years ago. The Russian Arctic has warmed 3.3 °C, roughly twice the global figure, and because its own equivalent level is higher still, it too falls short of it.
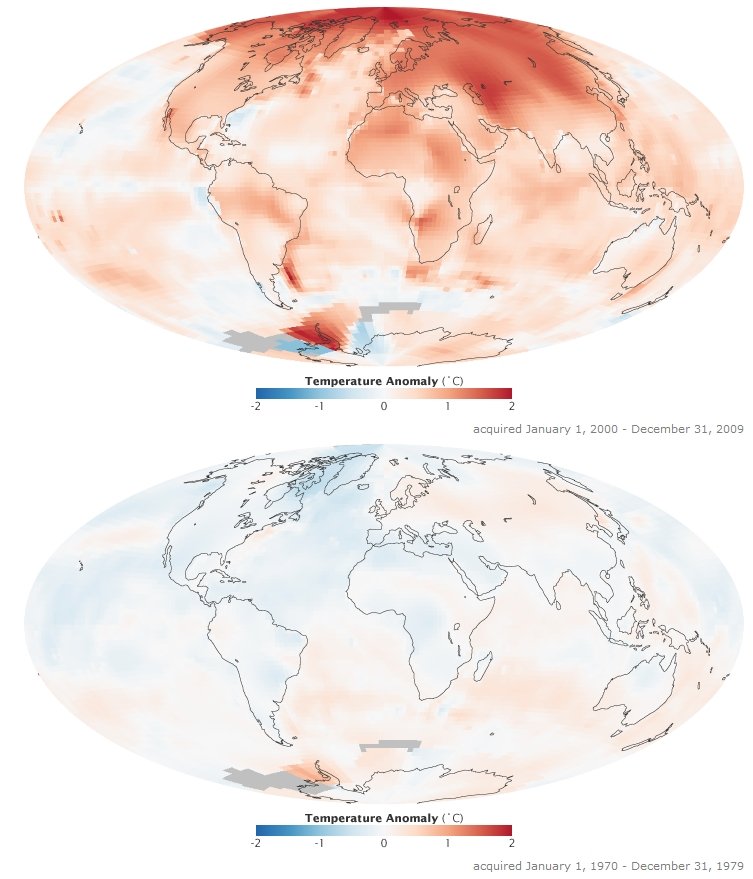
Nor are these thermometer readings. What the team estimates is attributed warming, the part of each region's temperature change that outside drivers caused, measured against the 1850 to 1900 baseline the IPCC treats as pre-industrial. Greenhouse gases account for the bulk of it, and industrial aerosols, which cool, cancel some of that out, most strongly in the industrial middle latitudes of the Northern Hemisphere. Natural drivers are not detectable in most regions at all.
The hard part was the regions with almost no thermometers
Measuring warming since 1850 needs records from then, and much of Africa, South America and the polar regions have sparse early data or none. The method the team used, called Kriging for Climate Change, handles that by starting somewhere other than the observations: 25 climate models supply a first estimate of the warming each region should have seen, and the measurements that do exist are then used to pull that estimate toward what really happened. The authors found that the global land record together with a region's own worked better than either on its own.
Whether an estimate built that way can be trusted is a fair question, and the authors tested it on model worlds where the true answer was known in advance. The warming signal came out larger than the estimation error everywhere except Antarctica. Confidence is highest across the tropics, including much of Africa, and not because the records there are good: the year-to-year swings in tropical temperature are small, so a trend stands clear of them. The method is weakest where that natural variation is wildest, in Greenland, northern Europe and the Russian Far East.
Richard Allan, a professor of climate science at the University of Reading with no part in the work and no declared conflicts, gave his reading to the Science Media Centre. "The study improves on tried and tested techniques to better account for regions of sparse data and while an even more comprehensive set of simulations could help make the attribution of past regional climate change to human causes even stronger, the findings seem robust," he said.
The band around each percentage is wide
Every region's uncertainty range reaches past 100 percent, which is why the authors write that current warming is already statistically indistinguishable from a 1.5 °C world. The best estimates are still 90% to 94%, which is below it. Both halves belong together: the central numbers say not yet, and the spread says the remaining gap is too small to resolve.
The width of that uncertainty is itself a result. Checked against the model worlds, the intervals the method called 90% held the right answer only 81% of the time, so the authors widened every one by a uniform factor of 1.31. That takes the average regional range to 0.67 °C, and the widest ranges sit on the largest numbers, in the high latitudes where natural variation is greatest.
The timing needs the same care. The paper puts the 1.5 °C threshold in 2029 and the 2 °C threshold in 2042, both under SSP5-8.5, the highest-emission pathway in the standard set and the only scenario the study runs. For the nearer date that choice hardly matters, because warming over the next few years is already largely set. For the later one it matters a great deal: on lower pathways 2 °C arrives materially later, and this paper examines none of them, so 2042 is the date under the highest emissions rather than the date 2 °C will arrive.
The nearer date does not rest on this paper's models alone. Indicators of Global Climate Change 2025, an annual assessment by a separate group in Earth System Science Data, puts human-induced warming at 1.37 °C in 2025 and rising at 0.27 °C a decade, from observations rather than a model constraint. That is within a few hundredths of a degree of the 1.4 °C this study derives for the global mean, and at that rate the distance left to 1.5 °C is about half a decade, with no scenario assumed at all.
The limitation the authors put at the end is the one Allan also named, and it is structural: the analysis rests on the climate models that happen to exist. They write that "the sample is small, … and may not represent the full range of plausible climate-system responses."
What it gives a region that had no numbers
The code and processed data are posted on Zenodo, so the calculation can be run again. What the work hands a planner, though, is less a warning about 2029 than regional numbers that did not exist before for data-limited places such as Africa and the Arctic. And the share of the threshold warming already realized came out much the same from one region to the next, which means nowhere is far behind: whatever adapting to a 1.5 °C world asks for, it is arriving almost everywhere on one timetable.