A Machine-Built Lower-Mantle Catalog, and a Mismatch Its Authors Cannot Yet Explain

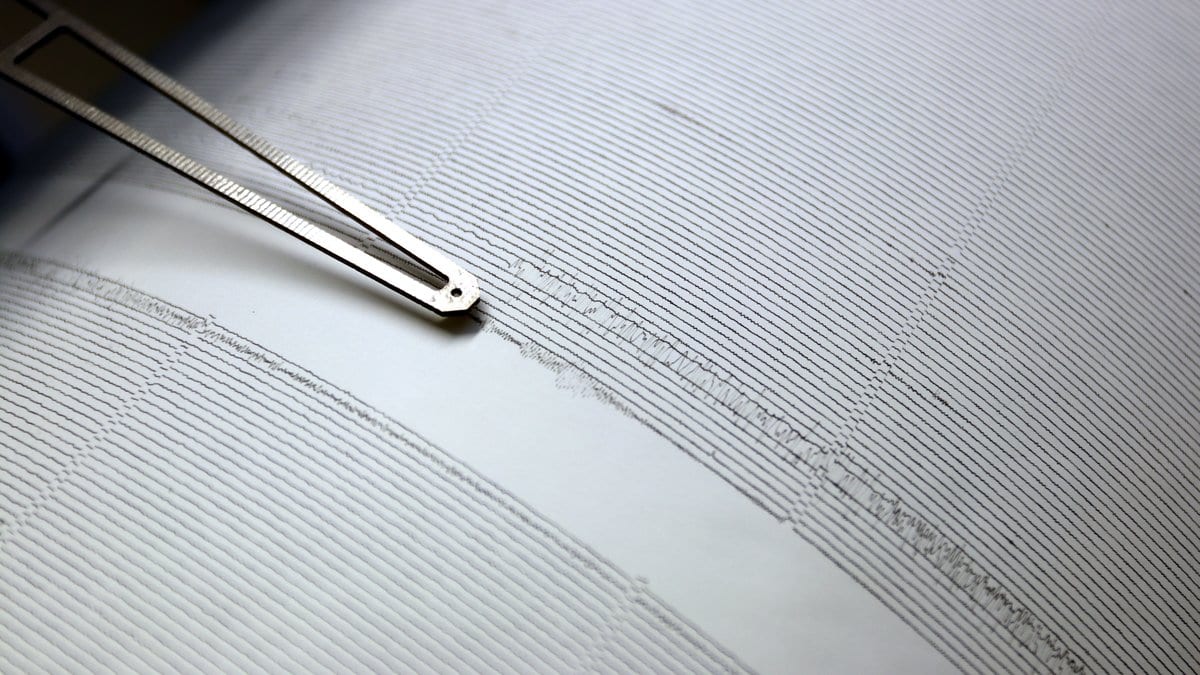
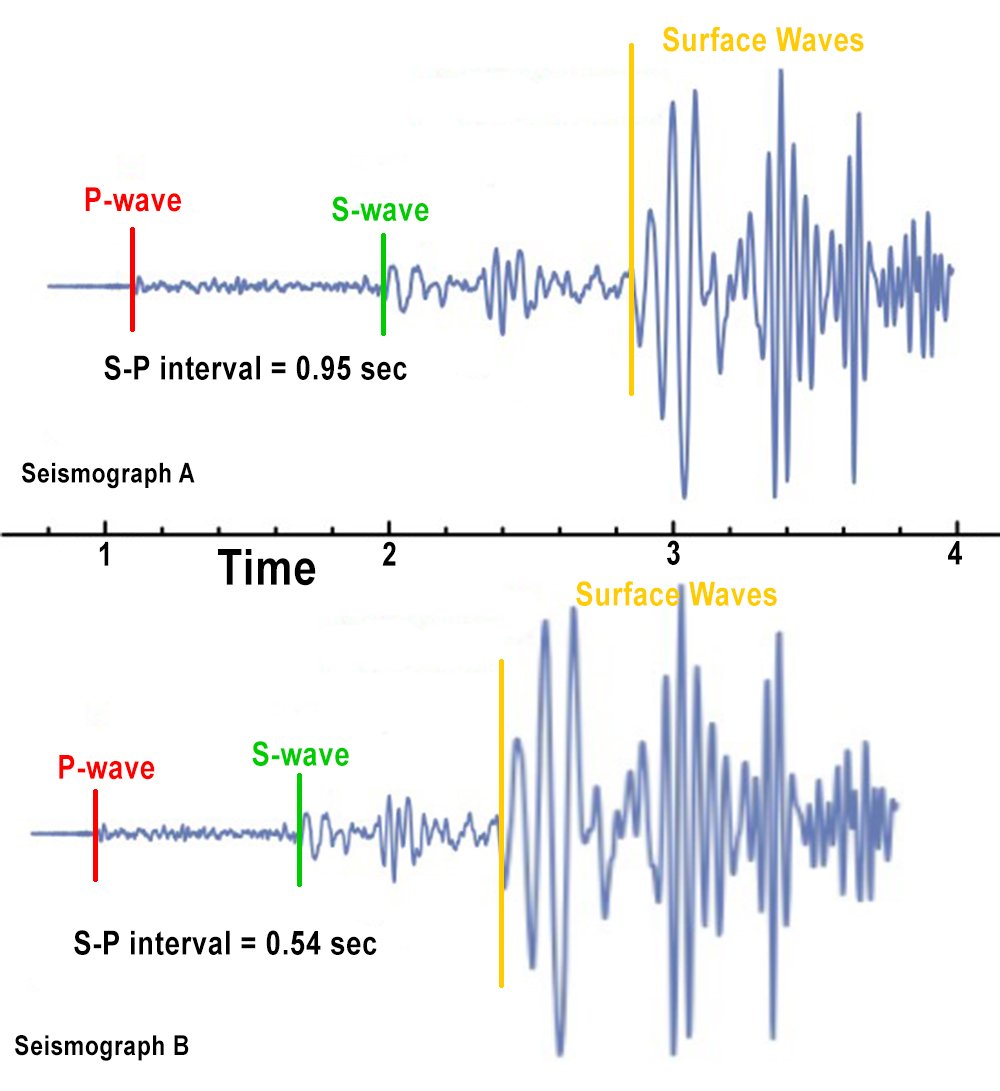
Somewhere on a seismogram the flat line starts to wobble. Deciding exactly where that wobble begins is the measurement: it fixes the moment a wave that set out from an earthquake on the far side of the world, after crossing the thick middle of the planet, reached the instrument. For most of the history of deep-Earth seismology, a trained person made that call, one trace at a time. The catalogs built that way are internally consistent, because one kind of judgment runs through all of them, and they are slow.
Jun Su of the Japan Agency for Marine-Earth Science and Technology, with Christine Houser and John W. Hernlund of the Earth-Life Science Institute at the Institute of Science Tokyo, has handed that call to a machine. Their catalog covers 2010 through 2023 and holds, in the paper's own word, millions of measurements of when P and S waves arrived, the fast squeeze and the slower shake every earthquake sends through the planet. They call it GLoBoCat, and it was published Oct. 13, 2026, in Seismica, a community-run open-access journal that charges no publication fees and posts its referee reports beside each paper.
The authors put the stakes plainly: travel times of long-period body waves passing through the lower mantle reveal the deep seismic structure and the forces shaping the planet. A wave crossing cold, stiff rock arrives slightly early; one crossing warmer, slower rock arrives slightly late. The pattern of early and late across many thousands of paths is what images of the deep interior are built from. The bottleneck was never how many earthquakes got recorded; it was how many of those recordings anyone had time to read. The paper's premise is that manual methods have not kept pace with the growth of waveform archives.
What the model does is narrow, and it is the hard part: find the onset. The paper's phrase for the method is attention-based machine learning trained on prior manual datasets. The authors' own data record, posted in May 2025, is more specific. The picking model learned from onsets that experts picked by hand for a 2008 mantle study by Houser and colleagues, and the trained weights are deposited with the data. The catalog there runs to about 2 million long-period P and S arrivals. They come from earthquakes above magnitude 5.5 in the Global CMT catalog, recorded at stations available through the IRIS Data Management Center over the same years. That posting came well over a year before the paper, so the count belongs to the deposited version rather than to the published one. Paper and data both carry a Creative Commons attribution license, so anyone can take the catalog and the picking model and use them with credit.
The check the paper offers on all of this is a qualitative one: the new catalog is consistent with the previous catalogs and retains their features. That is a real result, and it is not an independent test. One of those previous catalogs is the data the model was trained on, and Christine Houser is an author of both it and this paper. Agreement with the dataset a model learned from measures reproduction, not accuracy.
What the new catalog adds to the older ones is coverage. The authors report that it keeps the features of the earlier datasets while improving coverage in the lower mantle, most of all for the raypaths, the routes the waves take, that turn beneath the southern hemisphere. That is the part of the deep Earth the hand-built catalogs covered least well. The quieter claim is that the catalog is straightforward to update: a measuring step with no person inside it can be run again whenever the archives grow.
One reading in the catalog the authors do not resolve, and they say so. Set against short-period measurements of the same waves, their long-period times do not line up the same way for early arrivals as they do for late ones, and the difference between the two is larger for P waves than for S. A mismatch of that kind looks like dispersion, speed that depends on a wave's period. Their own word for it is apparent, and they write that its origin warrants further investigation.
Whether the lower mantle really is dispersive at these periods is a decades-old argument, and both standing families of explanation sit in this paper's own reference list. One is absorption in mantle rock, which would make waves of different periods genuinely travel at different speeds. The other is an apparent effect, in which wavefronts bend around small structures and then heal, pulling a long-period reading toward zero whether the wave arrived early or late. The second predicts no difference between early and late arrivals. Su and colleagues see one, and they report that the change in slope runs opposite to what the propagation explanation proposes. That is the narrow new thing in the paper, and it is why the paper ends with a measurement rather than a cause.