Someone Has to Click the Top of Every Lava Fountain

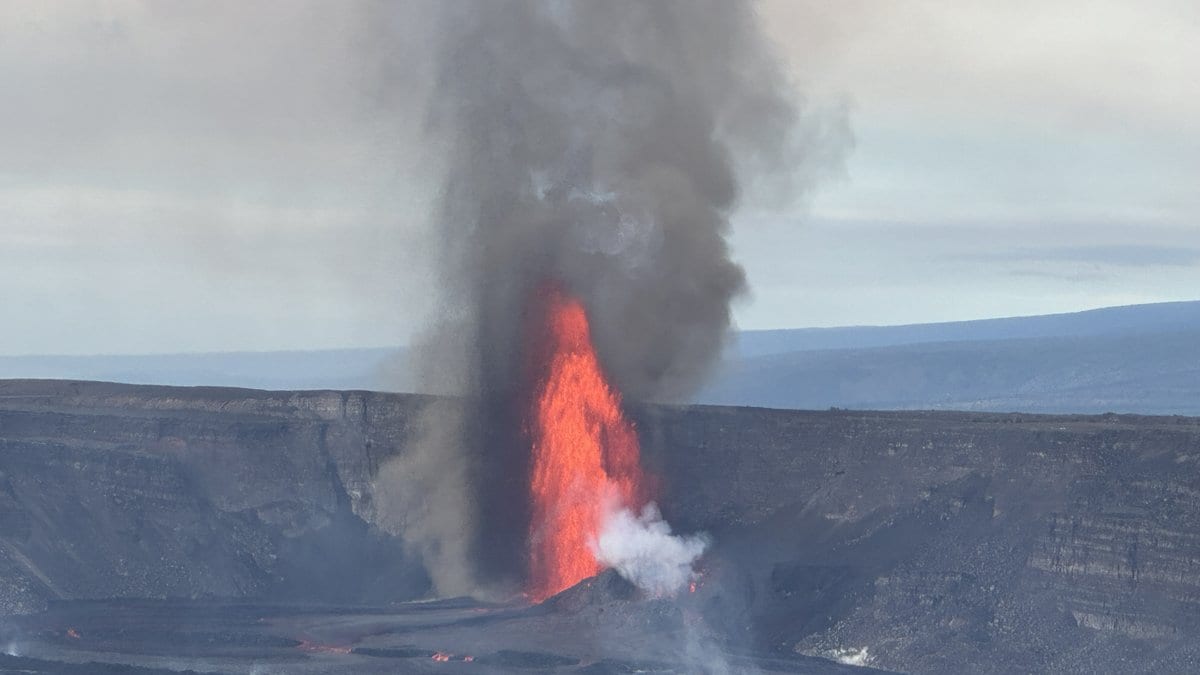
When a lava fountain at the summit of Kīlauea stops, somebody has to walk out to the rim of the caldera to fetch the pictures. The cameras that watched it do not send anything anywhere. They write one photograph a minute onto a card inside the housing, and the card has to be collected by hand. Then comes the slow part: a geologist opens the images one at a time and clicks on the top of the fountain, several hundred times in a row.
That is where the fountain heights in a news story about Kīlauea come from, and on Nov. 5, 2026, the U.S. Geological Survey's Hawaiian Volcano Observatory published a Volcano Watch column setting the whole procedure out. The observatory has had plenty of chances to practice it. Kīlauea has been erupting in episodes inside its summit caldera since Dec. 23, 2024, and the column counts 56 lava fountains in that time. Their peaks vary enormously: the column puts the low end at a little over 91 meters and the high end at over 457 meters, and those are the peaks of particular fountains rather than a typical height.
The fountains have stopped for the moment. Episode 56 ended at 6:01 p.m. HST on Nov. 5, 2026, the same day the column appeared, and in a notice issued the following afternoon the observatory lowered Kīlauea's Volcano Alert Level from WATCH to ADVISORY and its separate aviation color code from ORANGE to YELLOW. The same notice calls it "the ongoing Halemaʻumaʻu eruption": what ended was the episode, not the eruption itself. The column's own activity section, written while episode 56 was still going, no longer describes the volcano. Nor does anyone wander up to these cameras: the caldera rim around Halemaʻumaʻu has been closed to the public since early 2008, and the people swapping data cards are observatory staff.
Two sets of numbers, and only the second one is meant for science
There are two different measurements of a fountain's height, the column says, and they are not the same quantity. The first is made while the fountain is erupting: HVO scientists watch webcams such as the K2cam at Uēkahuna bluff and read the height off an overlay on the image, scaled approximately from the camera's field of view and its distance to the vent. Those are the figures that go into the status reports and daily updates during an episode. The second set is calculated after the episode has ended, from the timelapse images, and it is the one the column describes as more detailed and accurate, intended for scientific analysis.
The distinction matters if you ever go looking up the numbers yourself. HVO publishes a running table of every episode of this eruption, with a height for each, and that table carries its own warning: the values are unreviewed preliminary estimates from rapid analyses, subject to revision, and not suitable for research or quantitative work.
The calibration happens in a laboratory, before the volcano does anything
The accurate measurement starts with the hardware, and with a deliberate decision not to use a zoom. "These timelapse cameras have a fixed lens (no zoom) so their field of view is stable, which makes quantitative measurements from the images much simpler and less prone to error," the column explains. A stable field of view means the relationship between a pixel in the picture and a real angle in the world is fixed, and can be worked out once, in advance. HVO does that in the lab: it photographs a checkerboard calibration grid from a range of angles and feeds the images to software that computes the precise field of view and the amount of lens distortion.
None of this is new at the observatory. Timelapse cameras tracked fountain heights at Puʻuʻōʻō through the 1980s, when the images were stored on film that had to be developed; HVO geologists and field engineers have been building and testing systems ever since, homemade and off-the-shelf both. Today's are compact digital cameras that hold tens of thousands of pictures on a small data card. "These cameras run 24/7, and capture one image per minute onto their internal data cards," the column says.
The measurement itself is several hundred mouse clicks
Once the cards come back, the images are culled down to the fountaining episode itself and loaded into a second piece of software, one built for tracking a feature by hand through a sequence of pictures and recording where it was in each. "HVO geologists go through the images one by one and manually click at the top of the fountain," the column says. The output is a long list of pixel coordinates, and the column estimates an hour or so of clicking for the 500–800 images a single episode leaves behind.
Turning that list into meters takes two more steps, both arithmetic. Subtracting the pixel coordinates of the vent from those of the fountain top gives the height of the fountain in pixels. Converting pixels to meters needs the size of the ground area each pixel covers, which follows from the field of view measured in the lab and the distance between camera and vent, and HVO gets that distance from GPS coordinates and its own aerial mapping of the vent complex.
Why the published height is shorter than the one your eye reports
There is one more decision inside the number, and it is the reason the published heights can look too small against a photograph. "Note that the measurements are made to the top of the continuous fountain body—basically the portion that completely blocks the view to the other side," the column says. Above that solid column of lava there is usually a scatter of glowing fragments thrown higher still, and those are left out. A person watching the fountain counts them in without thinking about it, as the column points out, which is why the observatory's figure is the more conservative one.
It also means there is no single figure for the tallest fountain of this eruption, and three USGS documents give three different ones, at three different scopes. The column's figure of over 457 meters describes the peak of some of the taller fountains. The data release that accompanies the measurements reports that "By August 2026, 54 episodes of lava fountaining had occurred, with peak heights exceeding 500 meters." HVO's episode table puts the tallest single episode, number 43 on March 10, 2026, at 540 meters, with the preliminary-estimate warning attached. The three are not interchangeable, and the data release is careful about scope: it describes these fountains as being "on a scale unprecedented in the summit caldera since written records began in 1823," a claim about one crater rather than about Hawaii.
The one step the observatory has not handed to software
The obvious question about several hundred mouse clicks is why a machine is not doing them. The column asks it directly and answers with a qualified yes, then explains the difficulty: "But the top of the fountain is often subjective, or sometimes obscured, so it is a harder problem than it might seem at first." The fountain top is not a hard edge but a boundary somebody has to judge, and the published numbers rest on those judgments. "Right now, manual measurements are the most trusted, but applying AI to imagery like this is an ongoing project," the column says. That is neither a roadmap nor a refusal.
What the release contains is not one number per episode but a curve. The cameras were photographing at intervals of half a minute to a minute, the data release says, and the heights were measured through the course of each episode, producing a time series rather than a single reading. The figure that reaches a news story is the peak of that curve.
The measurements themselves are public, and so are the pictures they came from. The first 50 episodes of fountain heights, with the raw timelapse images, are deposited as a USGS data release by Matthew R. Patrick and Raymond G. Adams under a CC0 license, which puts them in the public domain and lets anyone re-measure the frames rather than take the observatory's clicks on trust. It is not a new dataset: its version text dates from August 2026 and it stops six fountains short of where the eruption now stands, with later episodes to follow in a future version.
The next version of the dataset will carry whatever the volcano does next. The method will not change: a camera on the rim, one frame a minute, a card carried back, and somebody at a screen deciding where the lava stops.