Warming Gives Germany's Summer Downpours More Fuel and a Harder Start

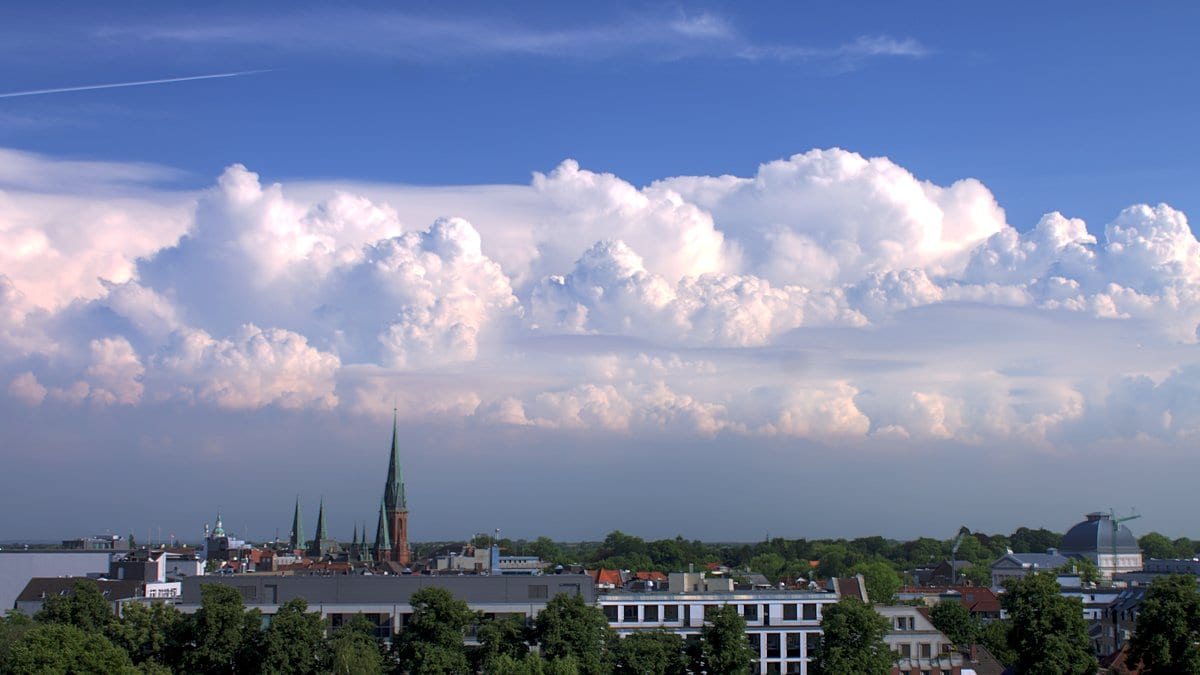
On the afternoon of June 17, 2001, the air over northeast Germany was primed for convection, and heavy thunderstorms broke over Hamburg and Berlin. Gerd Bürger and Maik Heistermann, environmental scientists at the University of Potsdam, use that day as the textbook case of what their work is about: not a weather front and not a long wet spell, but the short, violent summer downpour that fills a culvert in an hour. Their question, in a paper published Nov. 17, 2026, in Natural Hazards and Earth System Sciences, is whether a warming atmosphere will deliver more such afternoons. What they get back is a direction without a size.
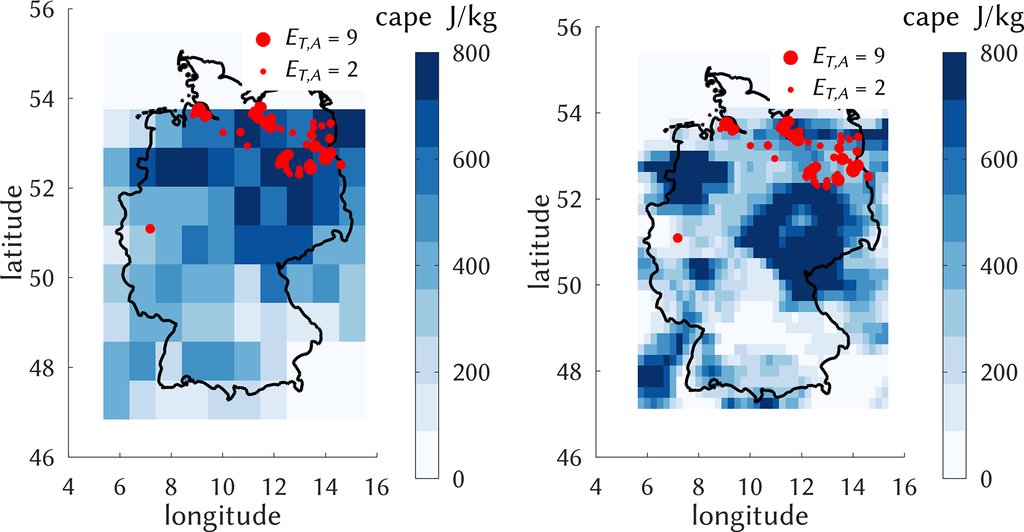
Their study begins with a catalog rather than a model. CatRaRE logs every rainfall event German weather radar has recorded above the national weather service's third warning level, which means 25 mm in one hour or 35 mm in six hours. Keeping only the summer months of May to August and events lasting at most nine hours, a 22-year record of hourly radar fields yields 20,824 cases. These are the rains that cause flash floods, which the paper, citing a 2022 damage assessment by Trenczek and colleagues, calls the most costly type of extreme event in Germany, at more than 70 billion euros in flood damage over the last two decades.
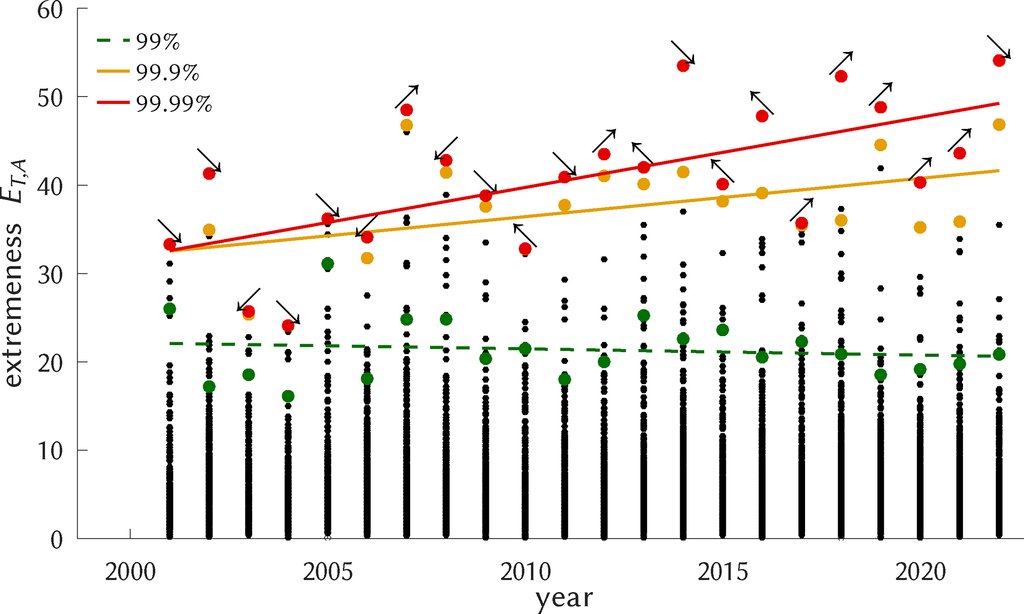
Before projecting anything, the two look at what the radar record already shows, and the answer sits in the far tail. Each year's events are ranked by an index combining area, duration and intensity. The annual 99.9th and 99.99th percentiles of that index rise significantly across the 22 years; the 99th percentile shows no trend at all. Counts of events crossing the catalog's upper thresholds drift upward too, but not significantly.
The fuel rises, and so does the brake
A warmer atmosphere holds more water vapor, so a downpour already under way falls harder; that much is settled physics. Frequency is the hard part, because warming lifts two quantities that pull against each other. One is the fuel, convective available potential energy, which sets how intense the rain becomes. The other is the brake, convective inhibition, the effort the air has to overcome before a storm can start, which sets how often one does. Both strengthen as greenhouse gases rise, a pairing established in earlier work: more moisture near the ground adds buoyancy, while over land a fall in relative humidity raises the height at which free convection can begin.
What that antagonism does to a projection is visible in two of the climate models the pair ran. In Germany's southwestern quadrant, simulations from CMCC-CM2-SR5 sent almost every trend line upward, and yet the high-emissions pathway produced a weaker trend than the moderate one, a difference the authors call noticeable, "but possibly insignificant." The reason they give is the brake: the fuel strengthens by similar amounts in both scenarios, while the inhibition strengthens markedly more in the hotter one and suppresses frequency. In the same region, MPI-ESM1-2-HR produced no significant trend under any scenario, and the authors write: "We have not been able to sort out any reason for this model behavior."
What 20 simulations agree on is the direction
That scatter is why the study is built as an ensemble rather than a case study. The pair collected as many CMIP6 simulations as carried the upper-air fields their method needs, 20 in all, counting separate runs of the same model as separate entries, and pushed each one through 12 classifiers, three severity levels and six regional classes. Dropping the classifiers with no skill and the two classes not tied to a region leaves 2,400 regional trends across the century, and of those only 610 are statistically significant. The abstract ends on what survives that: "Beyond all uncertainty, positive trends outweigh the negative ones for all regions." It is a count of signs. More trends point up than down, in every quadrant, and no particular rate of increase has been established.
Breaking that distribution apart statistically gives a two-part answer about where the uncertainty comes from. Across the full set of trends, the largest influence by far is the choice of climate model, ahead of the emissions scenario, while the choice of classifier and the region matter very little. Confine the same analysis to the significant trends and the model's influence shrinks sharply, leaving emissions as the sole dominant factor. Across the whole ensemble, the high-emissions median sits above the moderate one in all four quadrants, the direction the physics predicts and the opposite of the single southwestern example.
The rarest events are the ones the method reads worst
Judged against the radar record, the classifiers do work, and the winner is the plainest tool in the set: a random forest outperformed every deep learning network markedly and was clearly skillful both for all events and for the upper 10% of them. For the upper 1%, there is "almost no positive skill left," and the conclusions state that "towards the most rare and severe events the skill drops significantly." That class rests on 208 cases in the whole radar record. The same conclusions, though, read the trend evidence as firming up in exactly that direction: "This evidence, moreover, becomes clearer with growing levels of severity." The paper does not reconcile the two. What it names instead is the dilemma underneath them, that "increasing severity comes with a lower sample size and corresponding higher uncertainty," and the ensemble is offered as the counter to it: spread the modeling choices as wide as possible and read the distribution rather than any single run.
What the chain produces at every step is the probability that a radar-logged heavy rainfall event occurs, never the depth of the water, the size of a flood or the damage it does. Flash floods are the motivation for the work, not the quantity modeled. The ingredients are public: the CatRaRE catalog has its own DOI, the ERA5 reanalysis is open, and the analysis code is archived with a DOI too, so another group can rerun the chain on a different set of models. The paper went through the journal's open review, edited by Gregor C. Leckebusch with two anonymous referees, and it extends the pair's own 2023 study, which downscaled a single simulation and found the same upward direction. Their reading of what the ensemble now says stays deliberately narrow: "But still, our analysis finds evidence that across Germany they are occurring more often, with only little differences between regions."