Near the Ocean's Chronic Oil Slicks, the Species List Changes but Doesn't Shrink

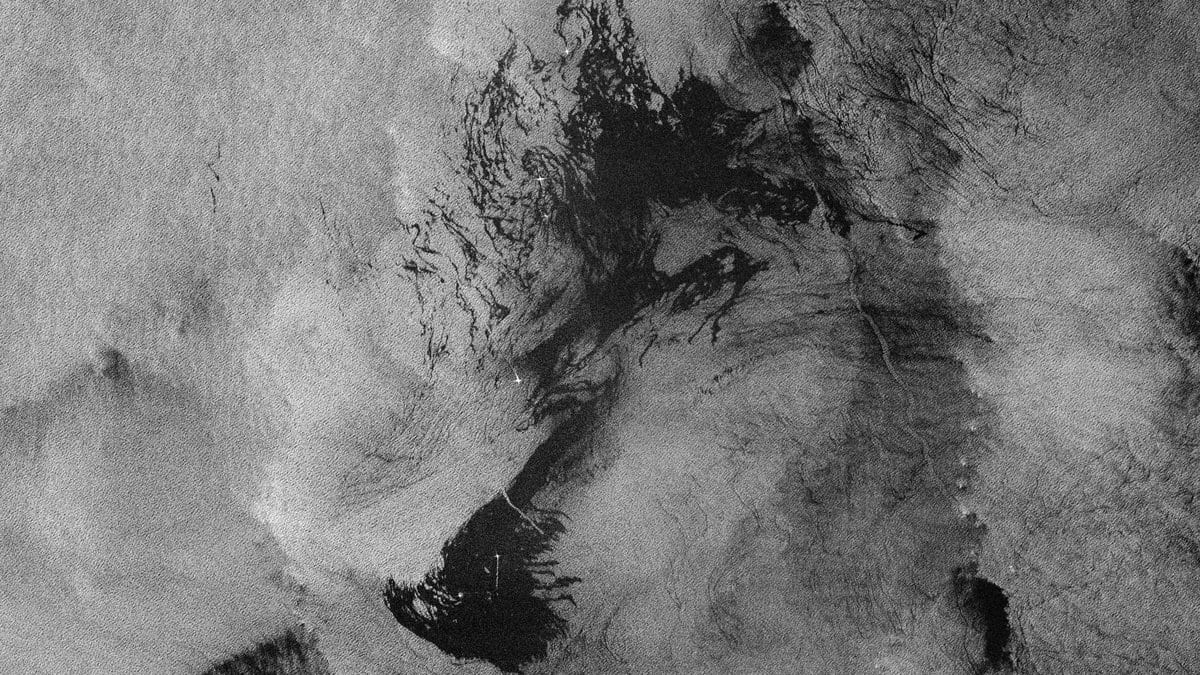
Oil on water does something a radar satellite can see. A slick flattens the small wind-driven ripples that bounce radar back to the spacecraft, so the sea beneath it returns almost nothing and the patch arrives as a dark smear on an otherwise bright image. The smear does not have to be large to show up. A slow weep from a wellhead, a routine discharge, a tank rinsed at sea, each leaving a dark ribbon a few kilometers long, there in one pass and dispersed by the next.
Chronic oiling is a different accounting problem from a blowout. A single large spill has a date, a responsible party and a number attached to it. A slick that appears beside the same installation over and over, each one small enough to disperse within a day or two, has none of those things unless somebody is watching continuously, which for the ocean means watching from orbit.
That everyday layer of oil pollution is now cataloged well enough to support a harder question: not how much oil is out there, but what lives where it keeps appearing. A study published Sept. 3 in Marine Pollution Bulletin does that at global scale. Its lead author is Bimini Horstmann, who works both at CEAB-CSIC in Blanes, Spain, and at the monitoring nonprofit SkyTruth; the senior author is Mikel Becerro of CEAB-CSIC. With colleagues, they take a global inventory of satellite-detected slicks and lay it over the maps that marine conservation planning runs on.
The detections come from Sentinel-1, the Copernicus program's radar satellites, processed through Cerulean, a slick-detection system built by SkyTruth itself. The detection layer here is the authors' own product, even though the analysis was peer-reviewed in an independent journal and the biological data came from elsewhere. Cerulean's added step is attribution: tying a detected slick to a plausible source rather than logging it as an anonymous stain. The team screened slicks potentially attributable to more than 24,000 fixed oil installations and 326 further offshore oil operating locations. More than 2,000 detections were checked by eye by a human reviewer before entering the analysis.
From that pool the team ranked offshore oil sources, globally and within European and Mediterranean exclusive economic zones, on a deliberately simple measure: the share of satellite passes over a site that come back carrying an attributed slick. It is a count of how often, not how much. A site that shows a slick in pass after pass is leaking as a matter of routine whatever the volume involved, and because Sentinel-1 images the whole ocean on a fixed schedule, the same arithmetic can be redone anywhere, by anyone with the imagery.
The second half of the paper is where the oil meets the biology. Validated slick locations were laid over marine ecoregions and protected-area boundaries, and over species data from Map of Life, a platform that assembles modeled range maps, where a species is expected to be found, inferred from occurrence records and habitat, rather than a record of what was swimming there on any given day. Around nine regions that showed chronic slicking, four of them in European and Mediterranean waters, the team pulled the species lists for concentric 50-kilometer bands radiating out from the slick sites and compared them.
The lists did not get shorter closer in. Species richness stayed relatively stable across the distance bands; what shifted was composition, meaning which species the maps place there. Splitting that difference showed turnover dominating: species swapped for other species rather than simply dropping out. In European and Mediterranean waters, proximity to a slick accounted for more than 40% of the variation in community structure across those mapped assemblages, ahead of fishing intensity or distance from the coast. Globally, the polygons nearest chronic slick sites carried a higher representation of threatened species in the Map of Life lists.
The authors' own verb is "correlated," and it carries the weight here. The species maps differ near chronic slicks; the analysis does not set out to show that the oil is what made them differ, and it could not. Range maps have a geography of their own: they are coarse, they are smoothed, and two neighboring bands are not independent samples. Thus, an association measured at that grain points to places worth checking rather than to damage already done.
The premise underneath the study has independent support. A 2022 analysis in Science led by Yanzhu Dong at Nanjing University went through 563,705 Sentinel-1 images and mapped ocean oil slicks worldwide, finding that 94% of the slick area was anthropogenic rather than natural seepage, and that most of it lay close to shore rather than in open ocean. So chronic oiling is mostly of human origin, and it happens in the busiest, most biologically crowded part of the sea.
What the new paper puts on the table is a procedure and a list of coordinates: sites that keep showing slicks, and the ecoregions, protected areas and mapped species that surround them. Whether those communities have actually changed is a question the satellites cannot answer. It needs surveys in the water, at sites the screen can now name.
Sources
- Marine Pollution BulletinPeer-reviewed
- doi.org