At Etna, the Ash Forecast Built From Etna's Own Eruptions Did Worst

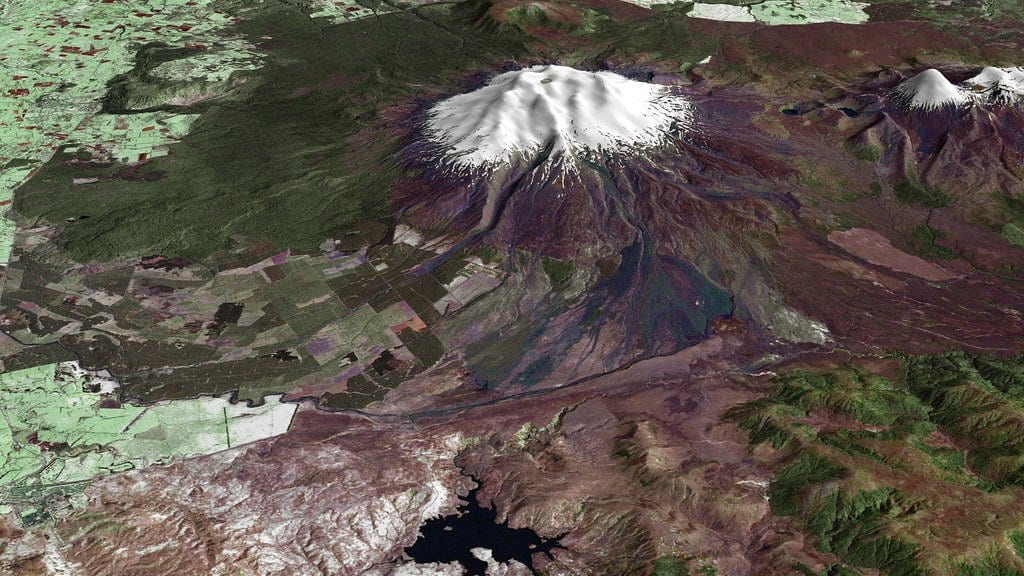
On the morning of June 17, 1996, Mount Ruapehu threw ash across the North Island of New Zealand and dropped it hundreds of kilometers downwind. Airports closed. The paper's account of that eruption's toll adds injuries, mostly from falls while clearing ash off roofs, and livestock killed by pasture contaminated with fluorine. It puts the cost at more than NZ$130 million in 1995/1996 values, about US$104 million. Everything done that day rested on a map of where the ash would land, and that map had to be drawn from numbers nobody could measure yet.
Three of those numbers matter most: how high the plume will climb, how much rock the eruption will throw out, and how coarse the ash will be. Forecasters fill those blanks from the volcano's own record of past eruptions, an assumption nobody had tested systematically. Emmy Scott and Stuart Mead, with two colleagues at Massey University's Volcanic Risk Solutions group, drew 17,000 sets of those guesses and ran each through an ash-dispersal model called Tephra2. Then they scored the output against ash that really fell: Ruapehu in 1996, Etna on Feb. 28, 2021, and Villarrica in Chile on March 3, 2015. At Villarrica, about 3,000 people were evacuated and nobody died. The study appeared Oct. 12, 2026, in the peer-reviewed journal Bulletin of Volcanology.
The problem is not only that these numbers are unknown before an eruption. The paper's starting point, taken from earlier work it cites, is that several different combinations of inputs can reproduce the same deposit afterward, so a simulation tuned to match the ash on the ground does not pin down what the volcano actually did.
What counts as getting it right
Ruapehu was the primary case, because the 1996 deposit is unusually well surveyed: 91 field measurements, from the volcano's flanks out to the far edge of the ash. Every simulation was checked at each of those sites and credited with a hit only where it landed the site in the right damage band, on an 11-step scale of harm to the built and natural environment.
By that test, 2.8% of the 7,000 runs made for Ruapehu cleared at least half of those sites at once. That is a joint standard rather than an accuracy rate: a single set of guesses had to work near the vent, at mid-range and far downwind simultaneously. Scored on the far sites alone, 17.6% of the runs cleared the halfway mark; scored on the sites closest to the vent, 0.6% did.
And 2.8% is a Ruapehu number, not a verdict on all three eruptions. The same test gave 23.7% at Etna and 18.6% at Villarrica, each measured over a much smaller survey.
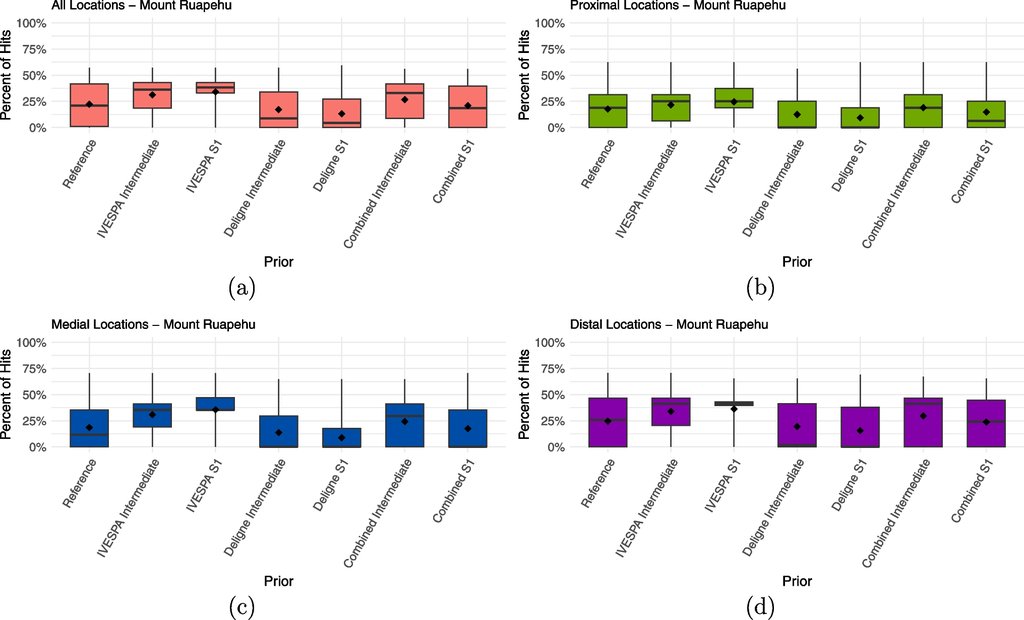
The authors read part of that pattern as a fact about the model rather than the volcano. Ruapehu's 1996 plume bent over in the wind rather than standing up, while Tephra2 releases all its ash from a straight vertical column, and the poor fit near the vent is partly that simplification showing.
The mass forecasts missed in one consistent direction: too much ash, and sometimes by an absurd margin. At one site where half a kilogram of ash per square meter was measured, a run in the ensemble laid down more than 275,000 kilograms.
Etna's own history finished last
The study's real question was never the score but whether narrowing the guesses helps. The authors report that "forecast performance did not differ systematically" between the broad baseline and the sets informed by a volcano's past, and the direction is not even uniform. At Villarrica the informed sets improved agreement with what had been measured. At Etna the pattern reversed: the two sets filtered to Etna's own narrow eruption class did worse than the broad baseline, while two drawn from a wider pool of volcanoes with similar magma did better. The worst performer of all was built entirely from Etna's own eruptions, at 16.9%.
A set built entirely from a volcano's own eruptions, finishing last at that very volcano, is the result worth sitting with. They are careful about two things. Even for somewhere as closely studied as Etna, "defining an appropriate analogue dataset remains challenging." And their own comparison cannot separate two changes at once: the informed sets dropped a built-in link between plume height and erupted mass that the baseline kept, so "differences in forecast performance cannot be attributed solely to the incorporation of prior information."
The settings a forecaster can actually change
The authors are explicit about what the test was not. Two things were deliberately taken off the table. The wind was held fixed: each run used ERA5, a reconstructed record of past weather, for the first hour of its eruption, "assuming there is no meteorological uncertainty" so that only the volcano's unknowns were on trial. A real forecast carries wind error too, which these runs were spared. The whole study also rests on one ash-dispersal model, its own key limitation. Tephra2 was picked because its inputs are documented well enough to take apart, while New Zealand's operational forecasts run probabilistic versions of a newer model, HYSPLIT. The scores are "not intended to assess absolute predictive accuracy" but to compare one set of settings against another when little is known in advance.
What the work does hand a forecaster is a short list of inputs worth arguing about. To reproduce the 1996 Ruapehu deposit the model needed roughly four times the ash mass actually measured, so the best-documented value is not the one that forecasts best. The grain-size values New Zealand uses operationally for volcanoes like Ruapehu come from the A.D. 79 eruption of Vesuvius, a far larger event at a differently classified volcano, and a likely source of bias. Analogs matched for size, magma and behavior would likely reduce it. The 17,000 runs behind these numbers are not deposited anywhere, and anyone wanting to recompute them has to write to the corresponding author. Their own next move is more interesting than any database they tested: whether a plume stands straight or bends over in the wind can often be judged on the day of an eruption, and that, not a volcano's classification, is where they would look for better inputs.
Sources
- Bulletin of VolcanologyPeer-reviewed